Every year, National Taxpayers Union (NTU) rates U.S. representatives and senators on their votes. Unlike most organizations that publish ratings, we refuse to play the “rating game” of focusing on only a handful of House or Senate votes on a few selected issues. Our scorecard includes every single vote that affects taxes, spending, debt, and major regulations. NTU’s voting analysis is the fairest, most accurate, and most comprehensive guide available on congressional members’ positions on issues important to taxpayers.
NTU has no partisan ax to grind. All members of Congress are treated the same regardless of political affiliation. Our only constituency is the overburdened American taxpayer. Grades are given impartially, based on the Taxpayer Score.
View the 2025 Taxpayers' Friend Award Winners.
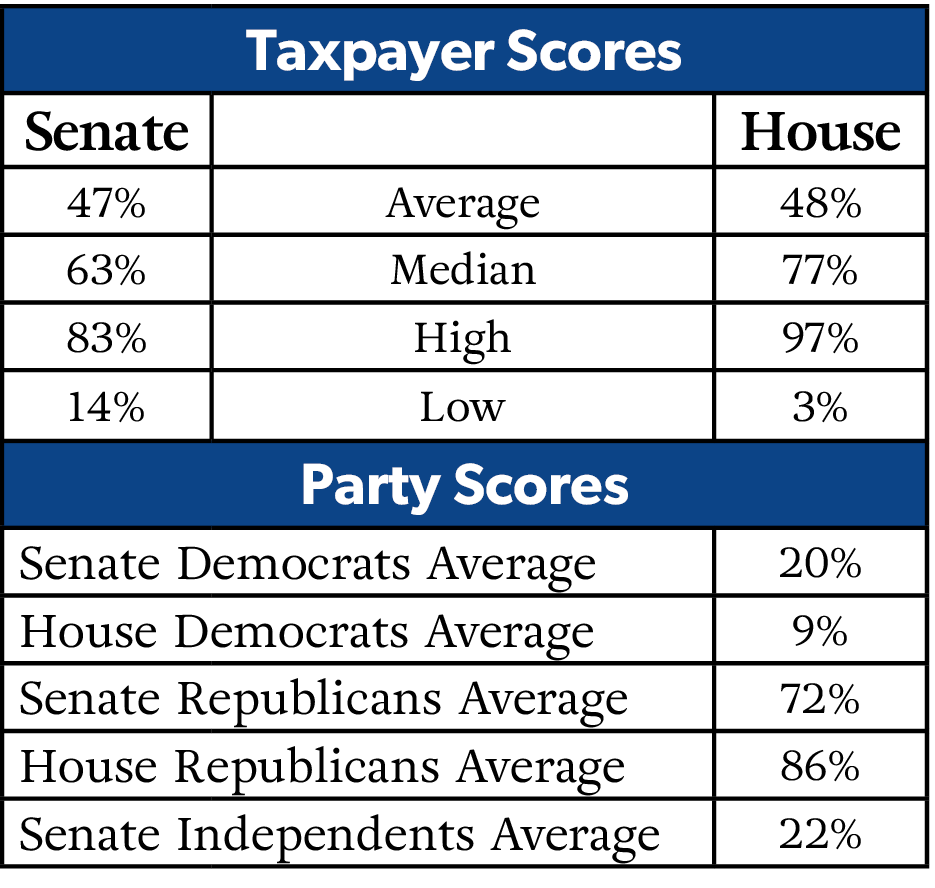
Taxpayer Score
The Taxpayer Score measures the strength of support for reducing wasteful government spending, opposing higher taxes, and often opposing burdensome regulations that can stifle U.S. economic growth. In general, a higher score is better because it means a member of Congress voted to spend less money.
The Taxpayer Score can range between 0 and 100. We do not expect anyone to score a 100, nor has any legislator ever scored a perfect 100—without missing a single vote—in the decades-long history of the comprehensive NTU scoring system. A high score does not mean that the member of Congress was opposed to all spending or all programs. High-scoring members have indicated that they would vote for many programs if the amount of spending were lower or if the spending were offset by cuts elsewhere in the budget. Indeed, a member who still wants to increase spending on some programs can achieve a high score if he or she votes for offsetting cuts. A 0 score would indicate that the member of Congress approved every spending increase and opposed every pro-taxpayer reform.
- Click here for the PDF publication of NTU Rates Congress for the first session of the 119th Congress.
- To view the list of votes used to establish the NTU Ratings, click here.
- Click here to view a full list of 2025 Taxpayers' Friend Award Winners.
- To view past scorecards, click here.
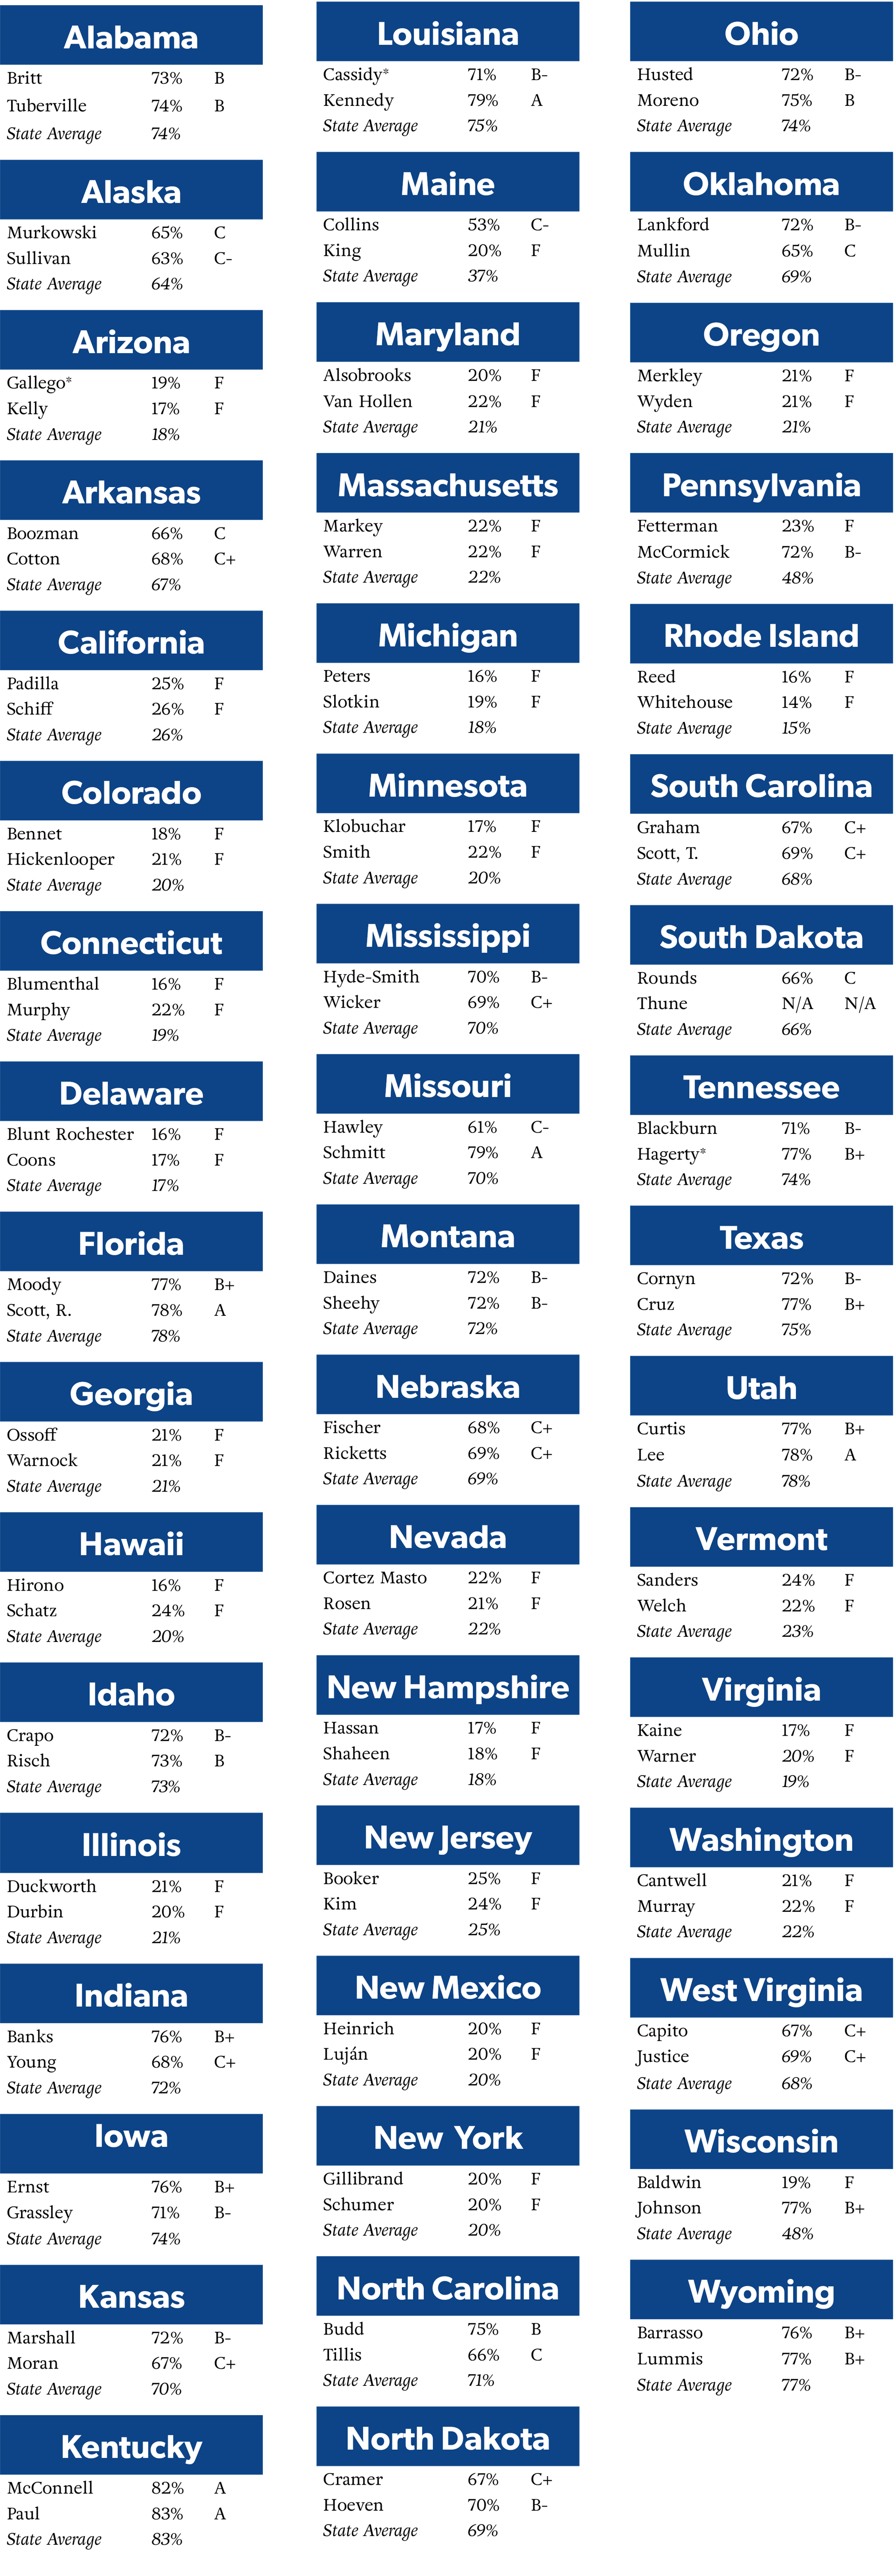
United States Senate
United States House of Representatives
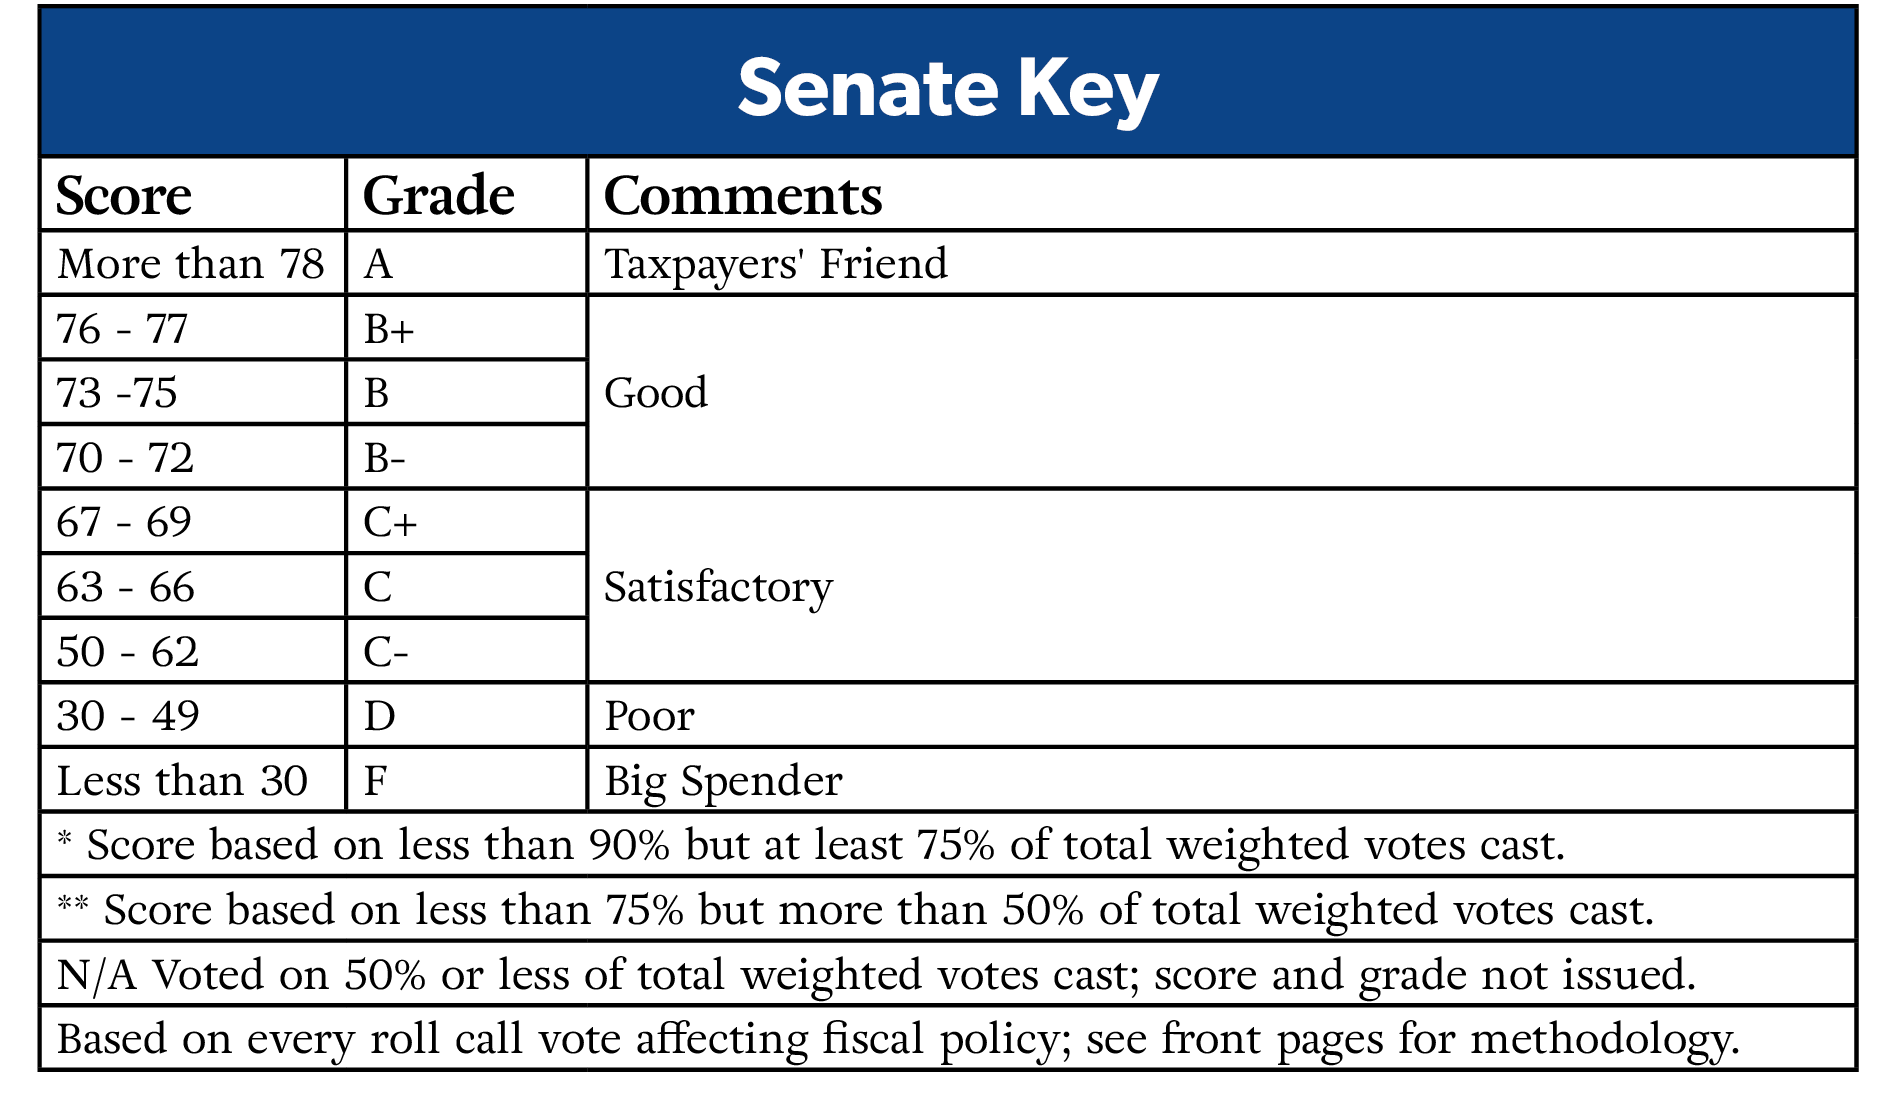
NTU believes a score qualifying for a grade of “A” indicates the member is one of the strongest supporters of responsible tax and spending policies. We are pleased to give these members of Congress our “Taxpayers’ Friend Award.” To receive a Taxpayers’ Friend Award, a member of Congress must have not only achieved a grade of an A, but also voted on a minimum percentage of weighted total votes in the House or in the Senate.
A score qualifying for a grade of “B” represents a “good” voting record on controlling spending and taxes. A “B” grade indicates that the member voted for taxpayers most of the time, but slightly less than those who attained the grade of “A.”
A score qualifying for a grade of “C” represents a minimally acceptable voting record on controlling taxes and spending. While such a score may be “satisfactory,” there is clearly room for improvement.
We also issue pluses and minuses for the grades of “B” and “C” in order to better recognize the differences in the voting records of members with these grades.
A score qualifying for a grade of “D” indicates the member has a “poor” voting record on controlling taxes and spending.
A score significantly below average qualifies for a grade of “F.”
Our scores and grades are not meant to offer definitive value judgments on any particular member of Congress, nor are they calculated with any favoritism or malice in mind. Rather, NTU Rates Congress is designed to offer a quantitative value that demonstrates a member’s voting record on fiscal and regulatory matters, large and small.
Computation
NTU’s federal budget experts assigned a weight to each roll call vote in the House and Senate. A lower weight was assigned to votes that had relatively smaller effects on the size of the federal budget and federal deficits, the scale and scope of federal tax revenues, or the size and scope of the regulatory state. A higher weight, on the other hand, was assigned to votes with the most significant effect on federal spending, deficits, taxes, or the size and scope of the regulatory state.
Consideration was given to the longer-term effects of a vote on future fiscal policy, even if relatively few tax or deficit-financed dollars might be immediately at stake.
Scores were computed by dividing the weighted total of votes cast against higher spending, higher taxes, or more regulation (or for lower spending, lower taxes, or less regulation) by the weighted total number of spending, tax, and regulatory issues on which the member of Congress voted. Average scores for each state were also computed using the weighted total of votes cast by each state delegation.
In computing these scores, we included only those votes on which the member actually voted for or against a bill, resolution, or amendment. Announced positions and absences were excluded.
Additionally, because some members either frequently miss votes, cast certain votes to permit the usage of procedural tools, or otherwise abstain from voting yes or no, their scores may not accurately reflect their stance on fiscal policies. The members falling into this category are noted. This can include the Speaker of the House and the Senate Majority Leader, who sometimes refrain from voting.
We analyzed every roll call vote taken in the First Session of the 119th Congress and selected all votes with a significant impact on federal taxes, spending, debt, or regulatory impact. A total of 123 Senate and 97 House votes met this standard.
We included votes cast on appropriations bills, authorization bills, budget resolutions, tax bills, amendments, regulatory proposals, and certain procedural and policy votes that could affect the burden on taxpayers. Votes that simply shifted equal amounts of spending from one area to another were excluded. Also excluded were unanimous votes and certain votes where there was a significant difference of opinion on how to vote to reduce or control the size of government.