Introduction
Taxes will dominate Congress’s agenda in 2025 as lawmakers confront the impending expiration of key provisions of the 2017 Tax Cuts and Jobs Act (TCJA). These expirations will spark intense debate over the future of the tax code, and will undoubtedly feature arguments from some that the wealthy do not pay their “fair share” of taxes.
That line of argument contrasts sharply with the reality that the tax code is very progressive—meaning that, as people earn more income, they pay more in taxes, while those working their way up the income ladder are largely spared from income taxes. Over the decades, reforms like the Tax Reform Act of 1986 and the Tax Cuts and Jobs Act of 2017 have reduced top marginal income tax rates, yet the share of the income tax burden borne by higher earners has generally increased.
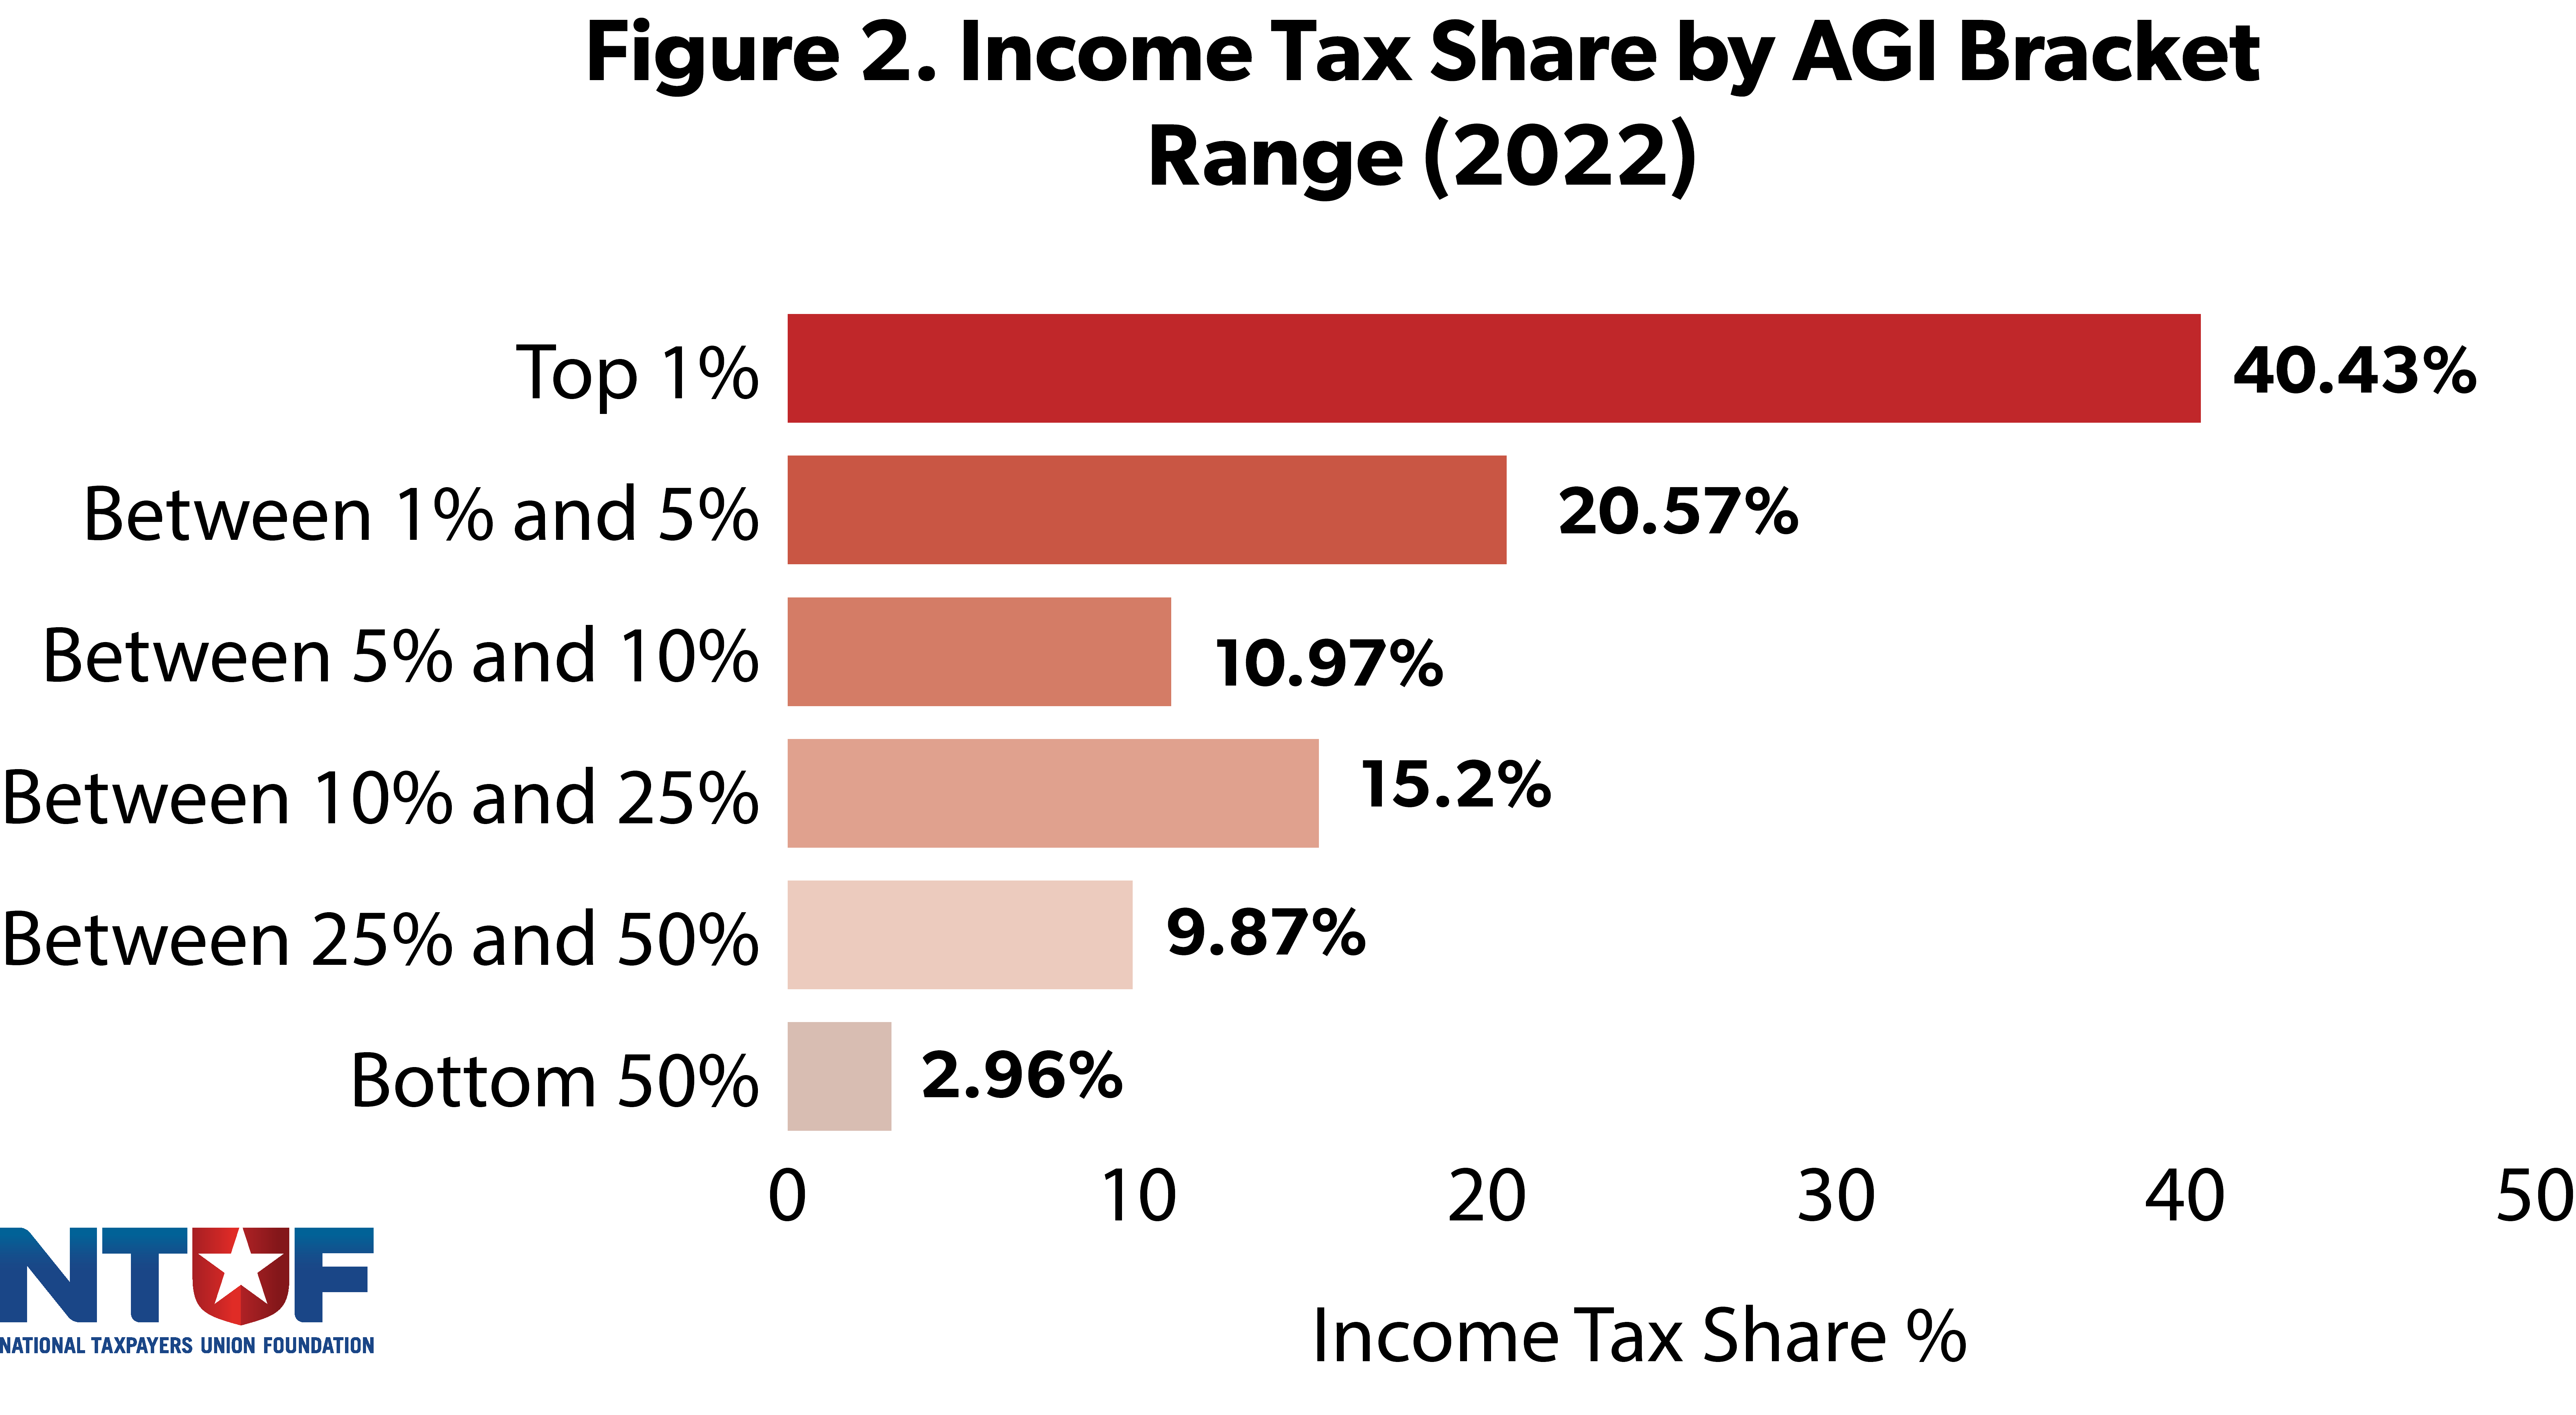
According to the latest IRS data, the top 1% of earners paid 40.4% of all federal income taxes in 2022. This underscores the extent to which the burden of the income tax system falls on taxpayers from the highest income groups.
Tax Shares in Tax Year 2022
The IRS’s Statistics of Income division publishes annual data showing the share of taxes paid by taxpayers across ranges of Adjusted Gross Income (AGI). The newly released report covers Tax Year 2022 (for tax forms filed in 2023). The newest data reveals that the top 1% of earners, defined as those with incomes over $663,164, paid nearly 40.43% of all income taxes—marking a significant drop from the previous tax year, as the economy improved in the wake of the pandemic and economic shutdown. This was a drop of 5 points (12% lower) than in 2021 when the top 1% paid nearly 46% of all income taxes. Similar to prior years of data, the amount of taxes paid by this percentile is nearly twice as much as its share of Adjusted Gross Income (AGI), underscoring the progressive nature of the tax system.

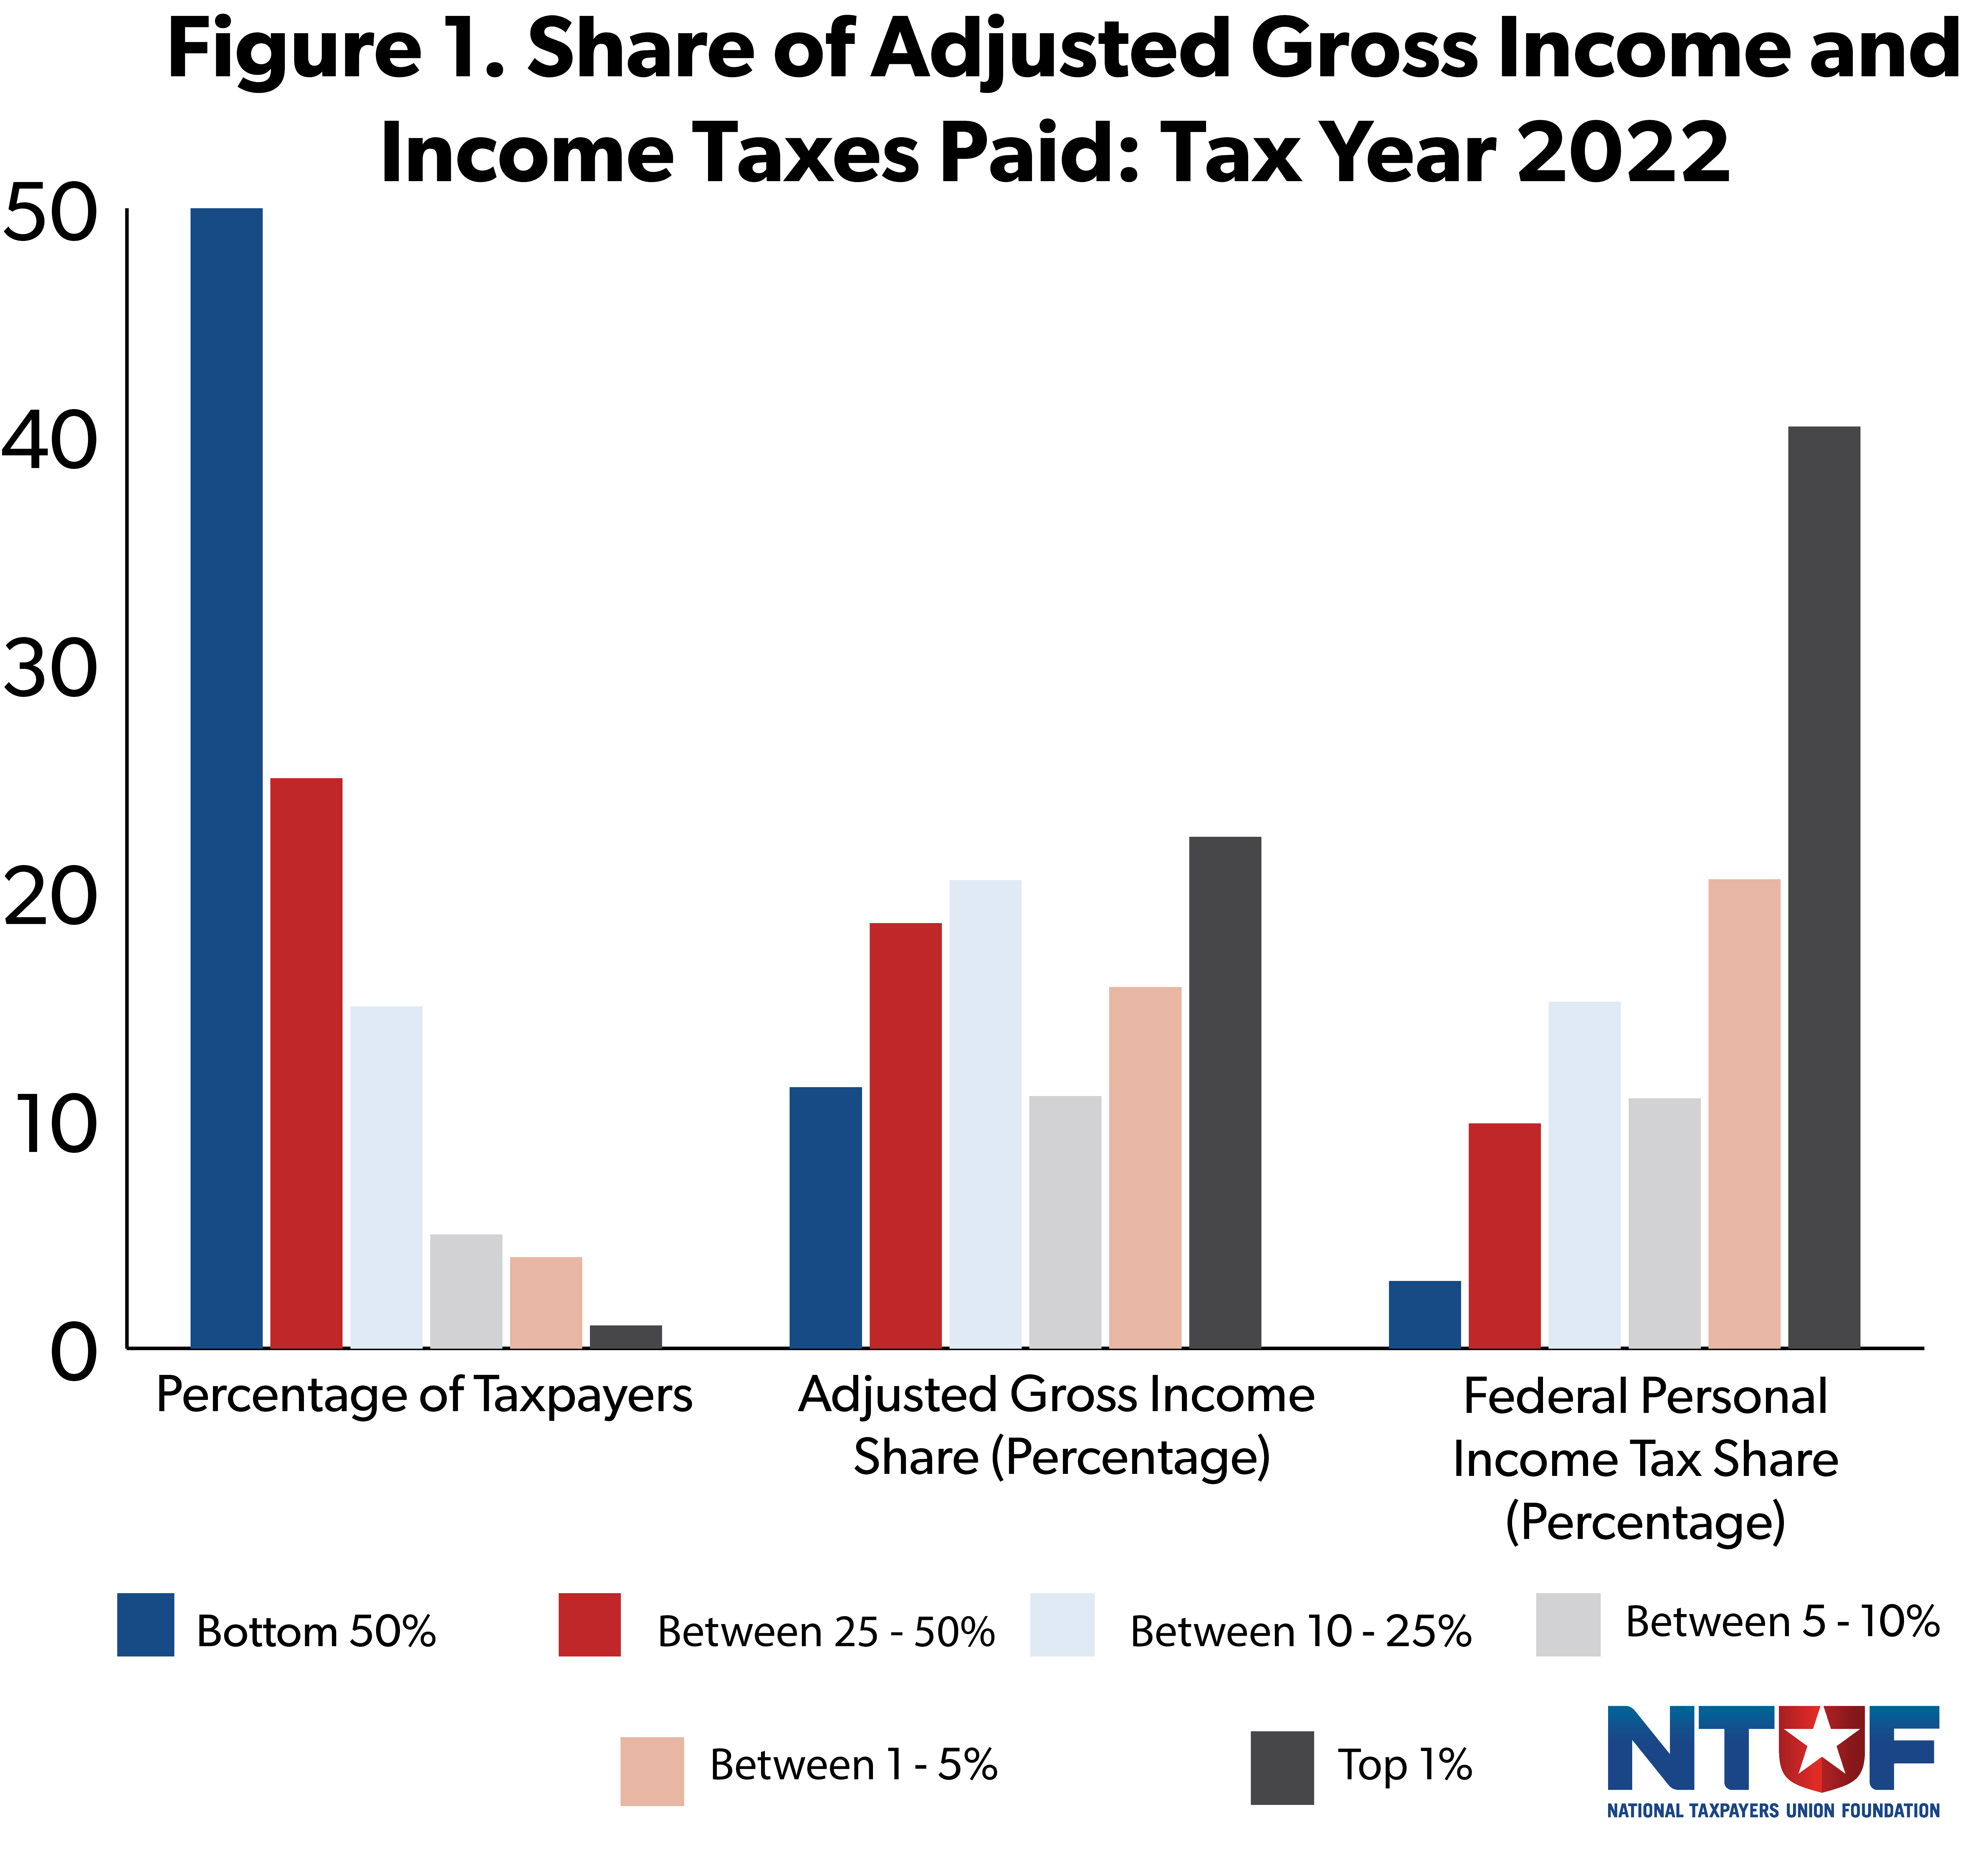
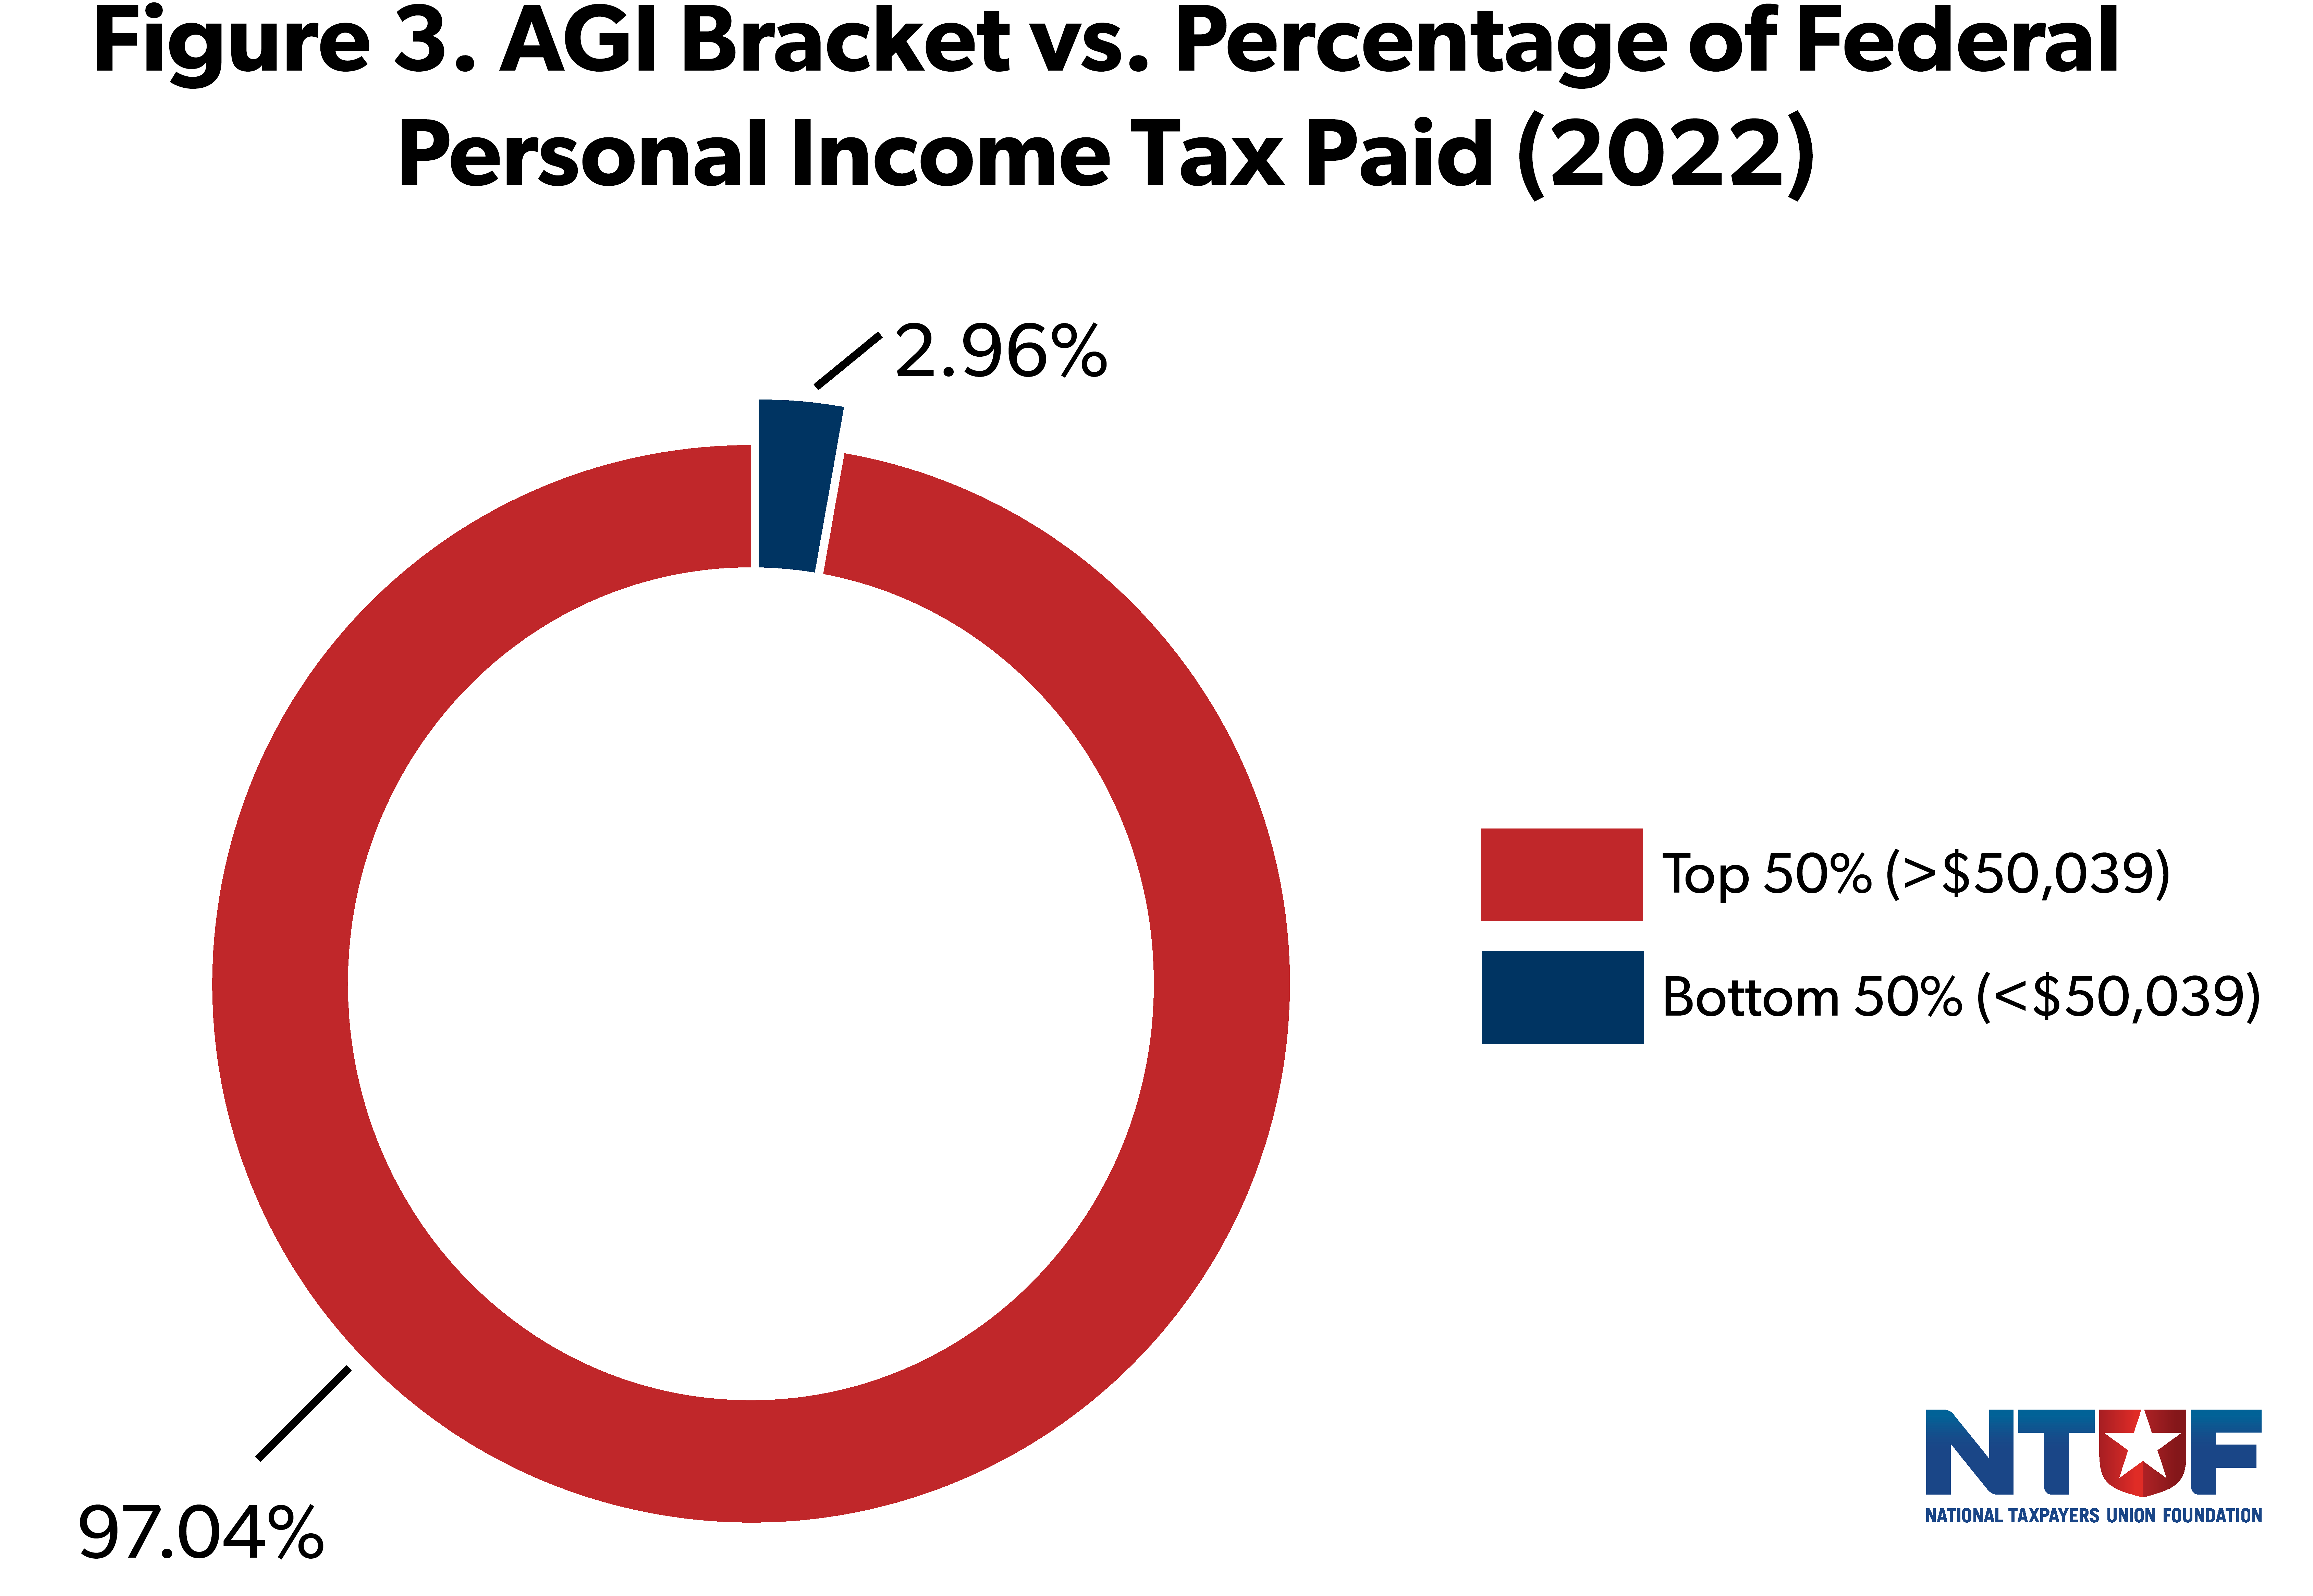
The top 10% of earners accounted for 72.0% of all income taxes paid in 2022, while the top 25% were responsible for 87.2%. Collectively, taxpayers in the top half of income brackets earned 88.5% of all income and shouldered 97.0% of the federal income tax burden.
In contrast, the bottom 50% of earners, defined as those with incomes below $50,339, paid just 3.0% of all federal income taxes. Many in this group owed no income tax due to having earnings below the taxable threshold or being eligible for tax credits that offset their liability.
Separate IRS data highlights that nearly 51 million tax returns in 2022 reported no income tax liability—31% of all returns—with 93% of these returns filed by individuals with incomes less than $50,000. This underscores the complexity of the tax system and the various factors influencing tax liability across income levels.
The column in Table 1 showing the Ratio of Personal Income Tax Paid to AGI Share highlights the progressivity of the federal income tax system. For example, the top 1% of earners, with incomes above $663,164, paid 40.4% of all federal income taxes, while earning 22.4% of the nation’s AGI. This results in a ratio of 1.8, meaning this group’s tax burden is nearly double its income share. Similarly, the top 5% of earners, who earned 38.3% of AGI, paid 61.0% of federal income taxes, for a ratio of 1.6.
In contrast, the bottom 50% of taxpayers, with incomes below $50,339, earned 11.5% of the nation’s AGI, but paid just 3.0% of total federal income taxes. Their ratio of 0.3 reflects the lighter tax burden on lower-income groups due to refundable credits, deductions, and other tax benefits. These ratios illustrate how the tax code is designed to collect disproportionately more revenue from higher-income taxpayers.
Historical Tax Share Data
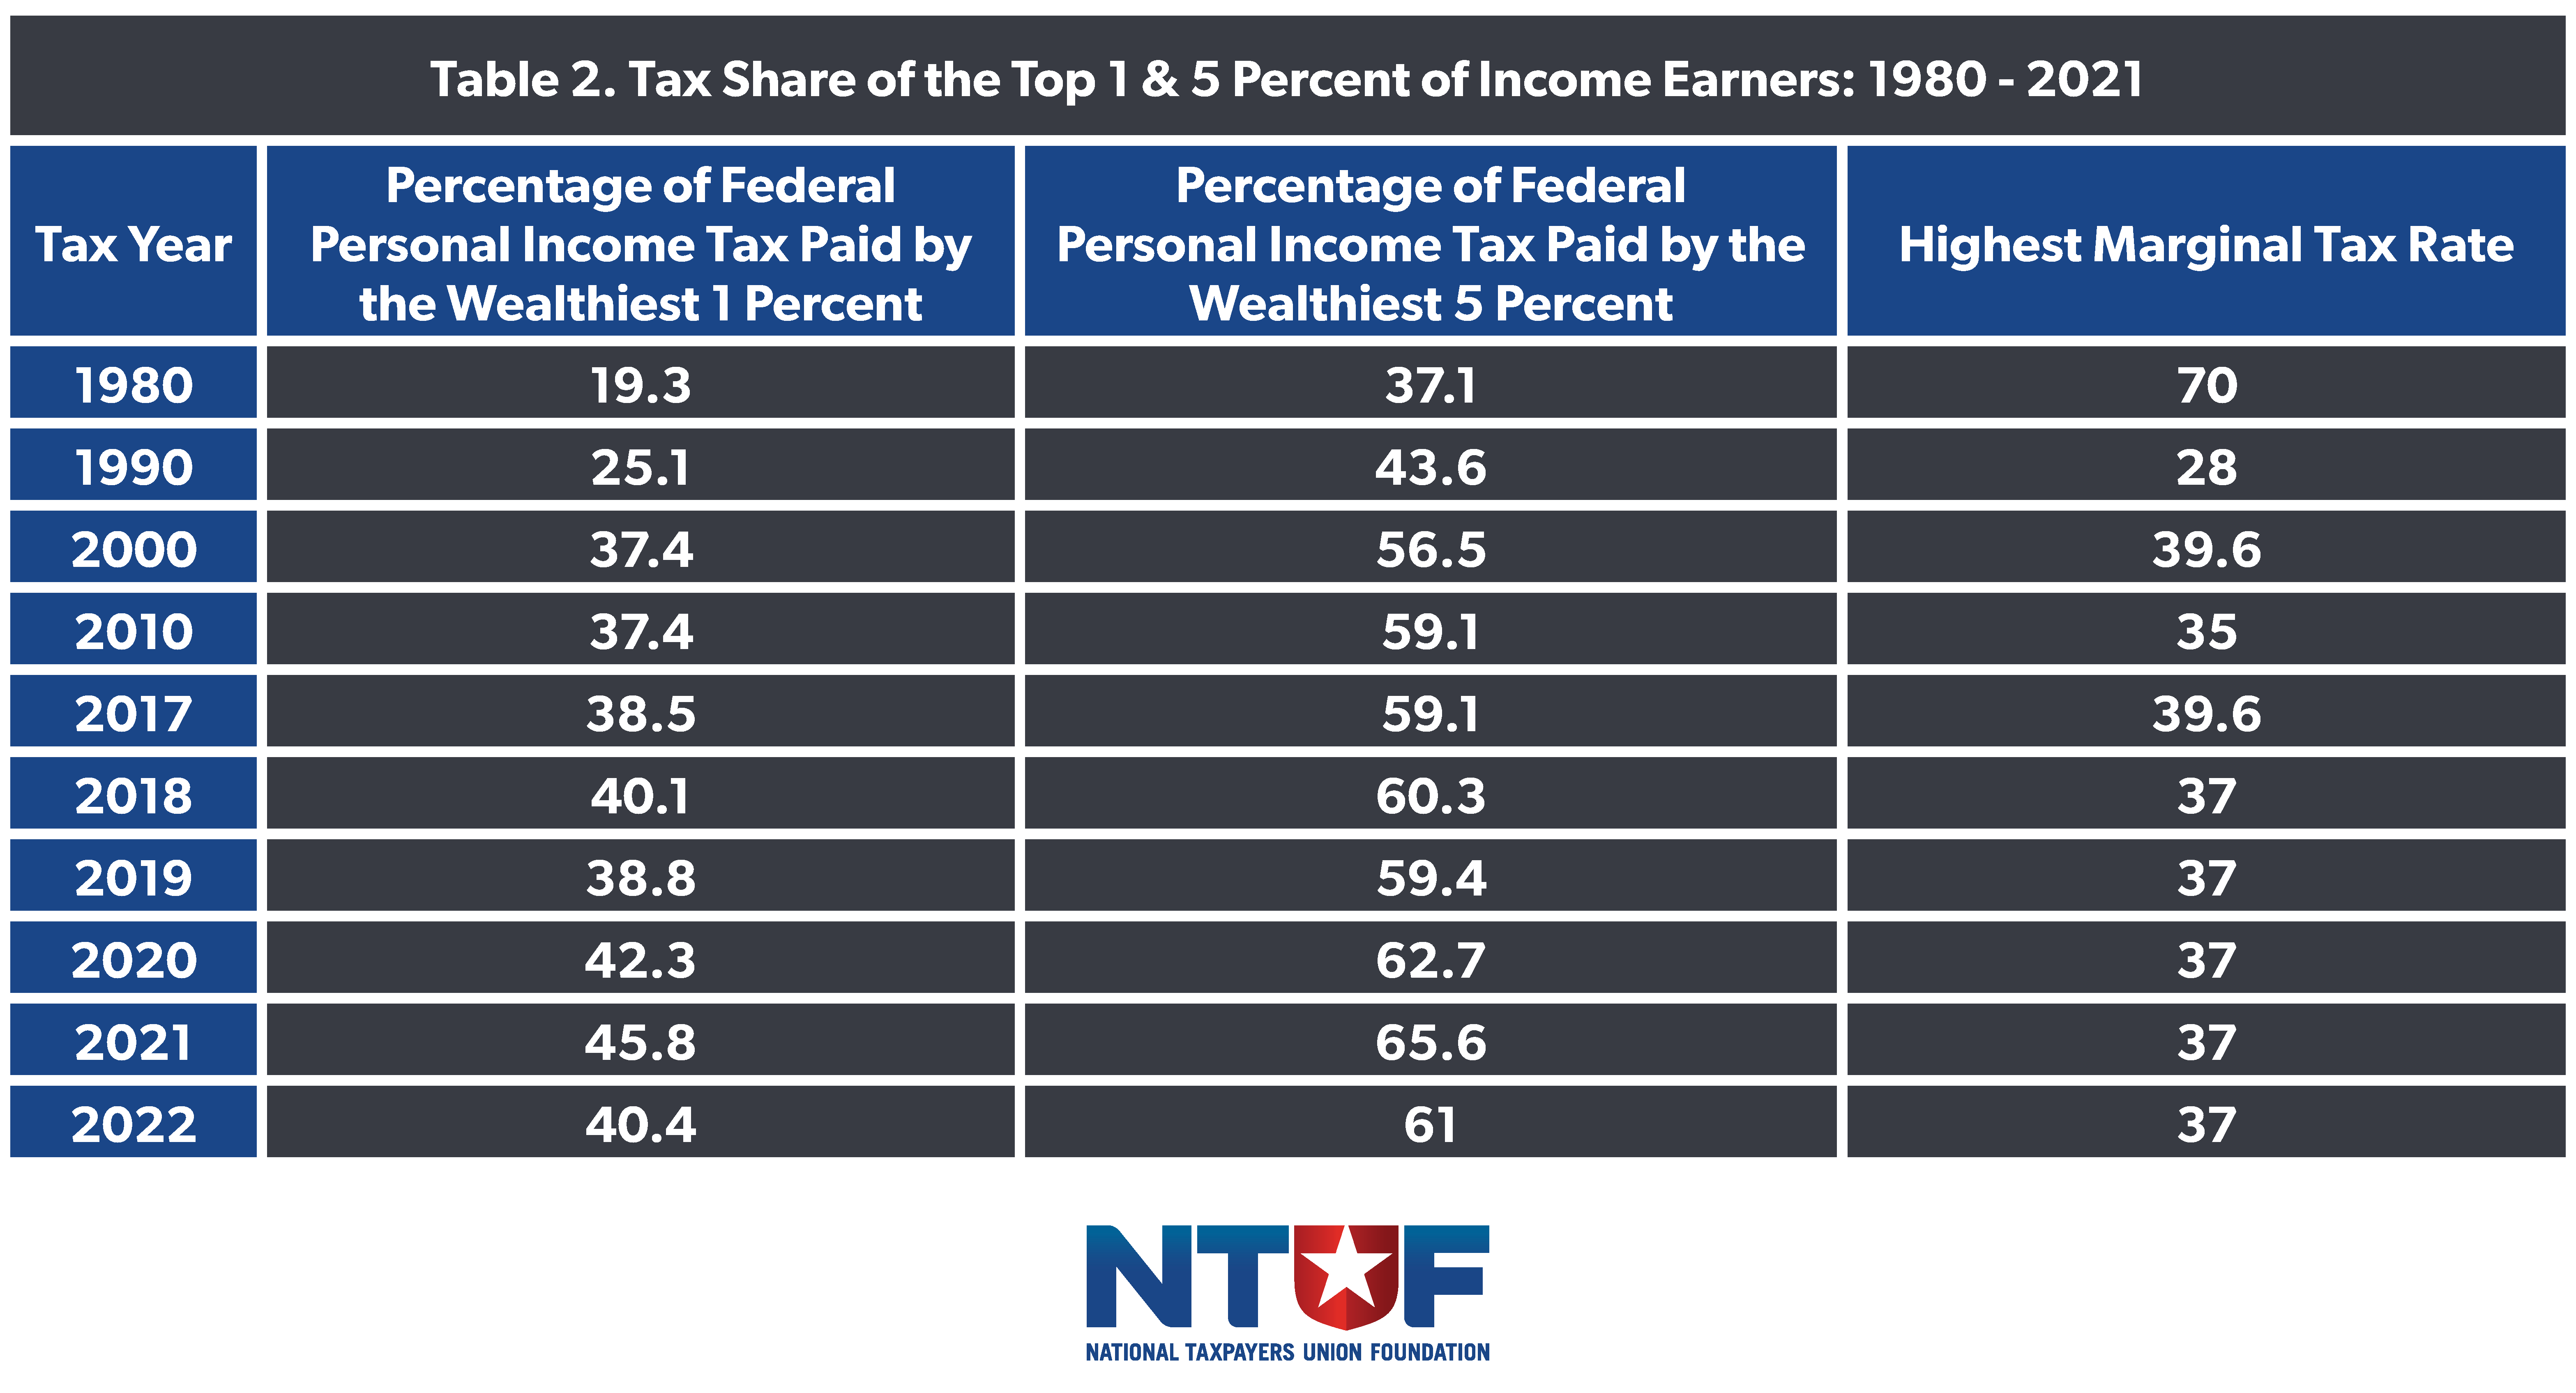
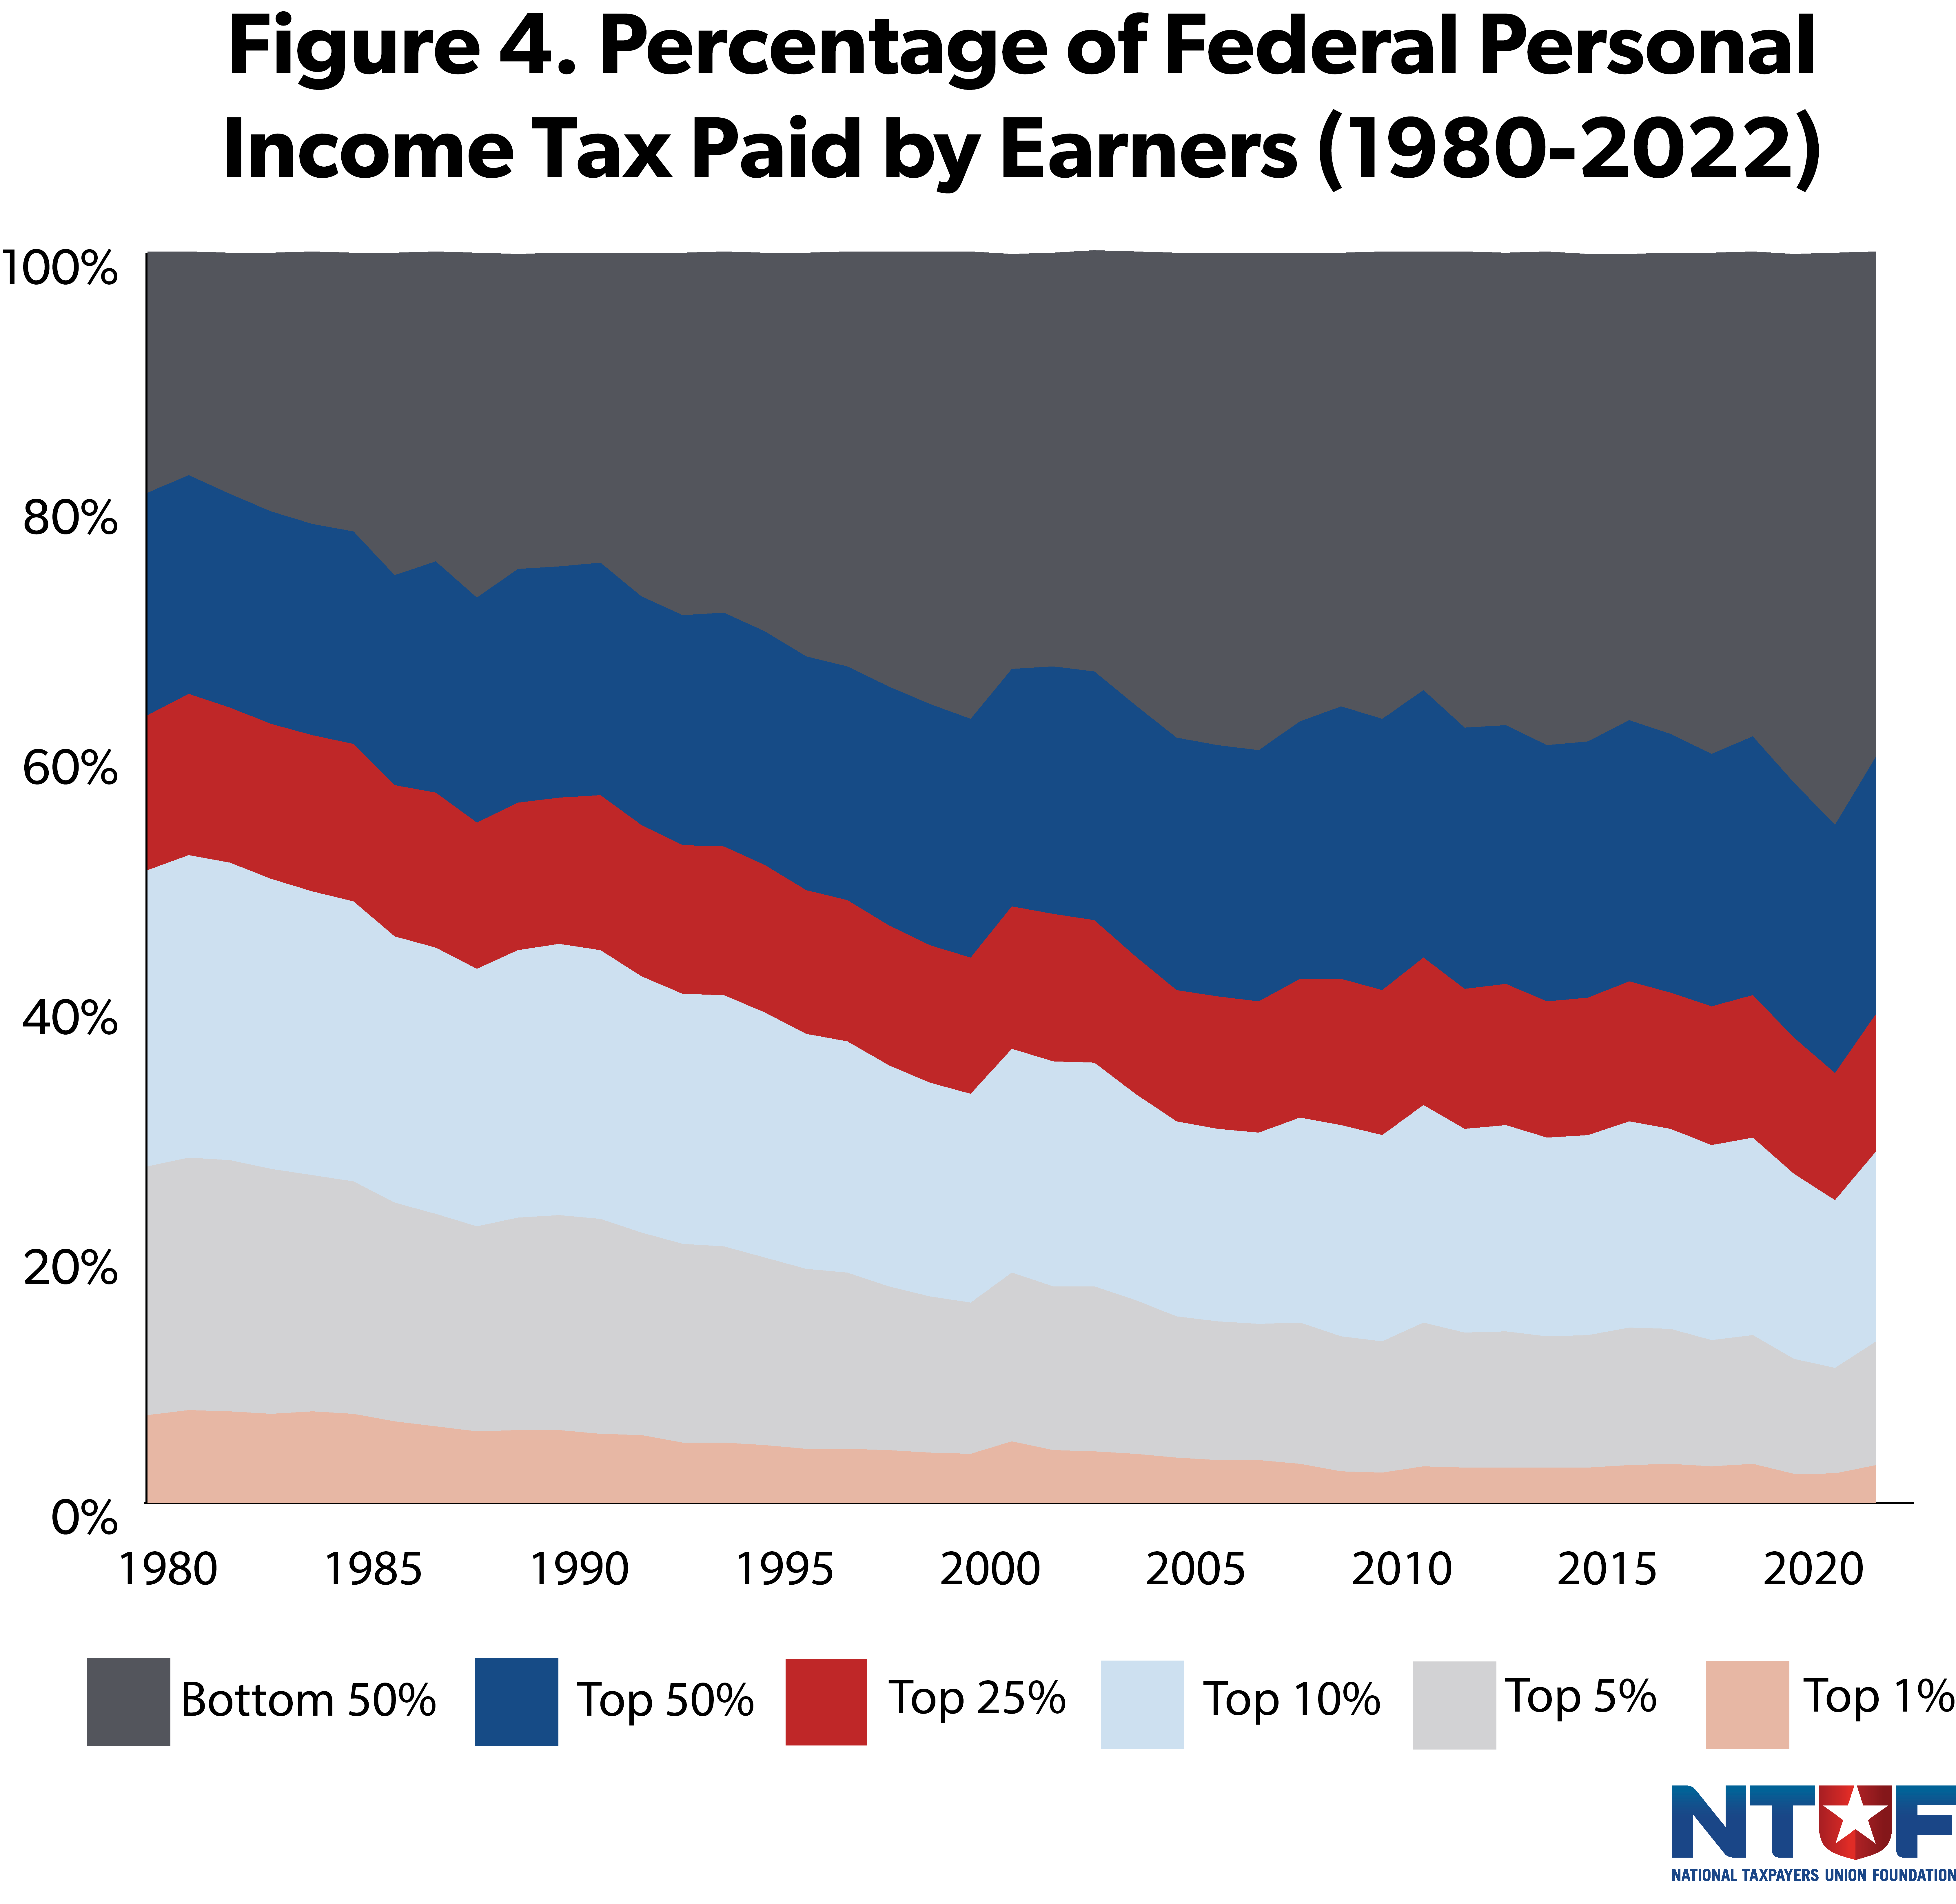
By 2022, the U.S. economy had largely emerged from the challenges posed by the coronavirus pandemic, with GDP and employment levels showing continued improvement. This economic rebound coincided with enduring trends highlighted in NTUF’s historical analysis of IRS data, which tracks how the federal income tax burden has shifted since 1980.
In 1980, the top marginal income tax rate was 70%, and the wealthiest 1% of earners paid 19% of all federal income taxes. Over the decades, their share of the income tax burden has consistently grown, even as top marginal tax rates were reduced significantly. At the same time, the tax share of the bottom half of earners has sharply declined—from 7% in 1980 to just 2.96% in 2022.
Conclusion
As Congress prepares to address the expiration of key provisions of the Tax Cuts and Jobs Act in 2025, debates over the fairness of the tax code are bound to intensify. Proposals to extend the TCJA’s reforms will face opposition from those arguing that the wealthy do not pay their “fair share.” However, the data tells a different story.
The U.S. income tax system is already highly progressive, with higher earners shouldering a disproportionate share of the tax burden. Given this progressivity, the benefits of tax relief inevitably go proportionately to those who pay income taxes. For those with little or no income tax liability, refundable credits play a significant role in delivering financial support, effectively providing targeted relief to low-income households.
Policymakers must approach the TCJA debate with a clear understanding of the progressivity of the income tax system and its implications. Extending tax cuts that encourage economic growth and allowing Americans to retain more of their income should remain a priority. A tax code that fosters opportunity, rewards productivity, and minimizes undue burdens will not only promote fairness but will also strengthen the nation’s economic future.
