
(pdf)
Introduction
Many left-leaning politicians have argued that the tax system is rigged to benefit those at the top, and that the wealthy are not paying their “fair share.” This is used to justify enormous tax increases, with some like Rep. Alexandria Ocasio-Cortez (D-NY) advocating for top income tax rates of 70 percent or more and presidential candidates Sen. Elizabeth Warren (D-MA) and Sen. Bernie Sanders (I-VT) introducing steep new wealth taxes as well. The income tax is only one component of tax burdens Americans face, but it generates by far the most revenue (over $1.7 trillion) and is changed more frequently than other sections of the tax code. That’s why the income tax is the centerpiece of many of the policy and political conversations about tax burdens and their impact on household budgets.
But new data from the Internal Revenue Service (IRS) shows that the income tax system has grown increasingly progressive since 1980, even as top marginal tax rates have been significantly reduced. The top income earners shoulder the majority of the income tax burden, far exceeding their adjusted gross income share, while those at the bottom are largely spared from income taxes.
For historical information:
- Analysis of Who Pays Income Taxes TY2016
- Analysis of Who Pays Income Taxes TY2015
- Analysis of Who Pays Income Taxes TY2014
- Who Pays Income Taxes TY2013
- Who Doesn't Pay Income Taxes?
New Data Highlights Progressivity of Income Tax Code
Each fall the IRS’s Statistics of Income division publishes an Individual Income Tax Returns Complete Report. The most recent report covers Tax Year 2017 (filed in 2018).
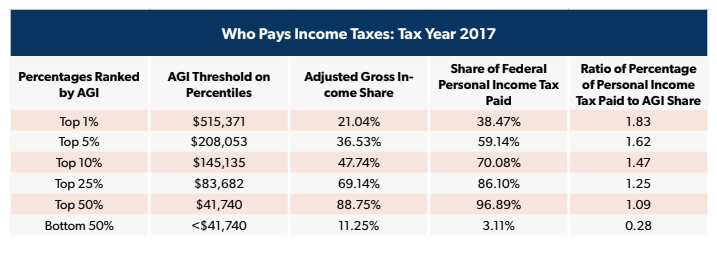
The new data shows that the top 1 percent of earners (with incomes over $515,371) paid nearly 39 percent of all income taxes, up slightly from the previous tax year’s 37 percent share. The amount of taxes paid in this percentile is nearly twice as much their adjusted gross income (AGI) load.
The top 10 percent of earners bore responsibility for 70 percent of all income taxes paid – up slightly from 2016 – while half of all tax filers paid 97 percent of all income tax revenue. Indicating the degree of progressivity in the code, the bottom 50 percent of earners took home 11 percent of total nationwide income while owing 3 percent of all income taxes.

NTUF has compiled historical data tracking the distribution of the federal income tax burden back to 1980. In that year, the income tax share of the top one percent of filers was 19 percent – half of what it is now (38.5 percent). And this happened despite the top marginal income tax rate falling from 70 percent in 1980 to 39.6 percent in 2013 through 2017. On the other side of the spectrum, the bottom 50 percent’s share has been cut. In 1980, it stood at 7 percent. That dropped to a low of 2.4 percent in 2010 (during the recession) before gradually rising to 3.1 percent in 2017 as the economy improved.
This will be the last year of data from before the implementation of the Tax Cuts and Jobs Act (TCJA). However, many of the provisions in the TCJA, including lower tax rates, nearly doubling the standard deduction, and expanding the child tax credit, are expected to result in the top earners bearing an even larger share of the income tax burden.
The trends are clear: the code has become increasingly progressive, and when people are allowed to keep more of their own money, they prosper, move up the economic ladder, and pay a bigger part of the income tax bill for those who aren’t.
Tax Cuts and Tax Fairness
After accounting for low-income levels and various tax credits, 32 percent of returns in tax year 2017 paid no income tax. This figure is up significantly from 21.3 percent in 1980, but the number of nontaxable returns has decreased from a high of nearly 42 percent in 2009 during the recession.
The TCJA is projected to remove additional people from income tax rolls by increasing the standard deduction and expanding refundable credits. A complete IRS analysis of Tax Year 2018 will not be available until a year from now, but the Tax Policy Center (TPC) and David Splinter of the Joint Committee on Taxation each estimated that the TCJA will lead to a 2 percentage and 3 percentage point increase, respectively, in the number of filers owing zero income taxes.
Nevertheless, progressives continually assail the TCJA, or any other income tax cut, as “unfair” by claiming that it solely benefits the wealthy. This ignores that most taxpayers paid less thanks to the TCJA. In fact, TPC estimates that nearly two-thirds of households paid less income taxes in 2018 than they would have under the pre-TCJA code, while 6 percent paid more (mostly due to the new cap on the state and local tax deduction impacting residents of high-tax states).
And while the total dollar value of tax reductions is naturally highest among those with very high incomes paying high effective rates, reputable dynamic analysis shows that tax reductions as a percentage of income range between 2.0 and 2.8 percent for each of the five income quintiles by the end of a 10-year scoring window. While the top quintile does see the largest reduction, all quintiles benefit from the economic growth spurred by the TCJA and its tax reductions. The second-largest comes in the lowest quintile, where tax burdens were already very low. This illustrates the broad-based nature of TCJA’s benefits.

Low-income households having very little tax burden to cut in the first place, in dollar terms, is also why “tax cut” proposals targeted at lower-income households rely heavily on “refundable credits” which can be paid out above and beyond a filers’ income tax liability as direct spending through the tax code. For example, the IRS reports that filers claimed $100 billion in refundable credits in 2017. Of this amount, $5.4 billion was applied toward reducing income tax burdens and $10 billion against other federal taxes. The remaining $84.6 billion was essentially converted into subsidy checks, mostly from eligibility for the Earned Income Credit ($56.8 billion) and the Additional Child Tax Credit ($23.3 billion). Lower tax rates allow Americans to keep more of their earned income, whereas refundable tax credits provide subsidies.
The IRS 2017 data shows that filers with AGI under $30,000 had an average income tax rate that was negative, thanks to the refundable credits. As filers’ income increases, the average tax generally increased. Those in a range from below to just above the income of the middle-class, with AGIs in the range from $50,000 to $200,000, paid an average income tax rate of 10.8 percent. The top one percent (incomes above $515,371) paid an average income tax rate of nearly 27 percent.

Conclusion
The distribution of the tax burden is an important issue impacting the debate surrounding tax policy as the 2020 race for the White House heats up. When looking at the income tax alone, the federal government’s largest revenue stream, current numbers from the IRS show that America’s code remains very progressive. Lower-income households face negative tax burdens, with effective rates rising with steadily as income increases. This suggests that any kind of tax plan intended to pay for a massive spending program like “Medicare for All” or student loan forgiveness would have a hard time raising sufficient revenue without dramatically increasing taxes on middle-income households.
A responsible tax system eases the burden on those at the bottom striving to work their way up. But it also should be careful that the marginal rates at the higher levels don’t provide disincentives to greater earnings and productivity. Making one of the most progressive income tax codes in the world even more progressive risks doing just that.