
View PDF
Introduction
As lawmakers increasingly call for higher taxes under the guise of “tax fairness” or to support expensive spending programs, it is important to understand who bears the majority of the income tax burden. NTUF’s annual Who Pays Income Taxes report, based on the latest data from the Internal Revenue Service (IRS), highlights the progressivity of the tax code. NTUF finds that, on average, the top 1 percent of earners bear the largest share of the federal tax burden (46 percent), paying nearly twice as much in taxes as their share of Adjusted Gross Income (AGI). Lower income earners are largely shielded from income burdens, with the bottom half of taxpayers contributing 3 percent of all income taxes.
The IRS further breaks down its data on federal taxes and taxpayer AGI by state, showing where the taxpayers are that pay the largest percentage of the federal tax burden. Analyzing this data from 2021, the most recent year of data available from the IRS, both confirms what we already know about our progressive federal tax code and provides a warning for overzealous states with wealthy taxpayers.
Overall Most Income Taxes Paid by State
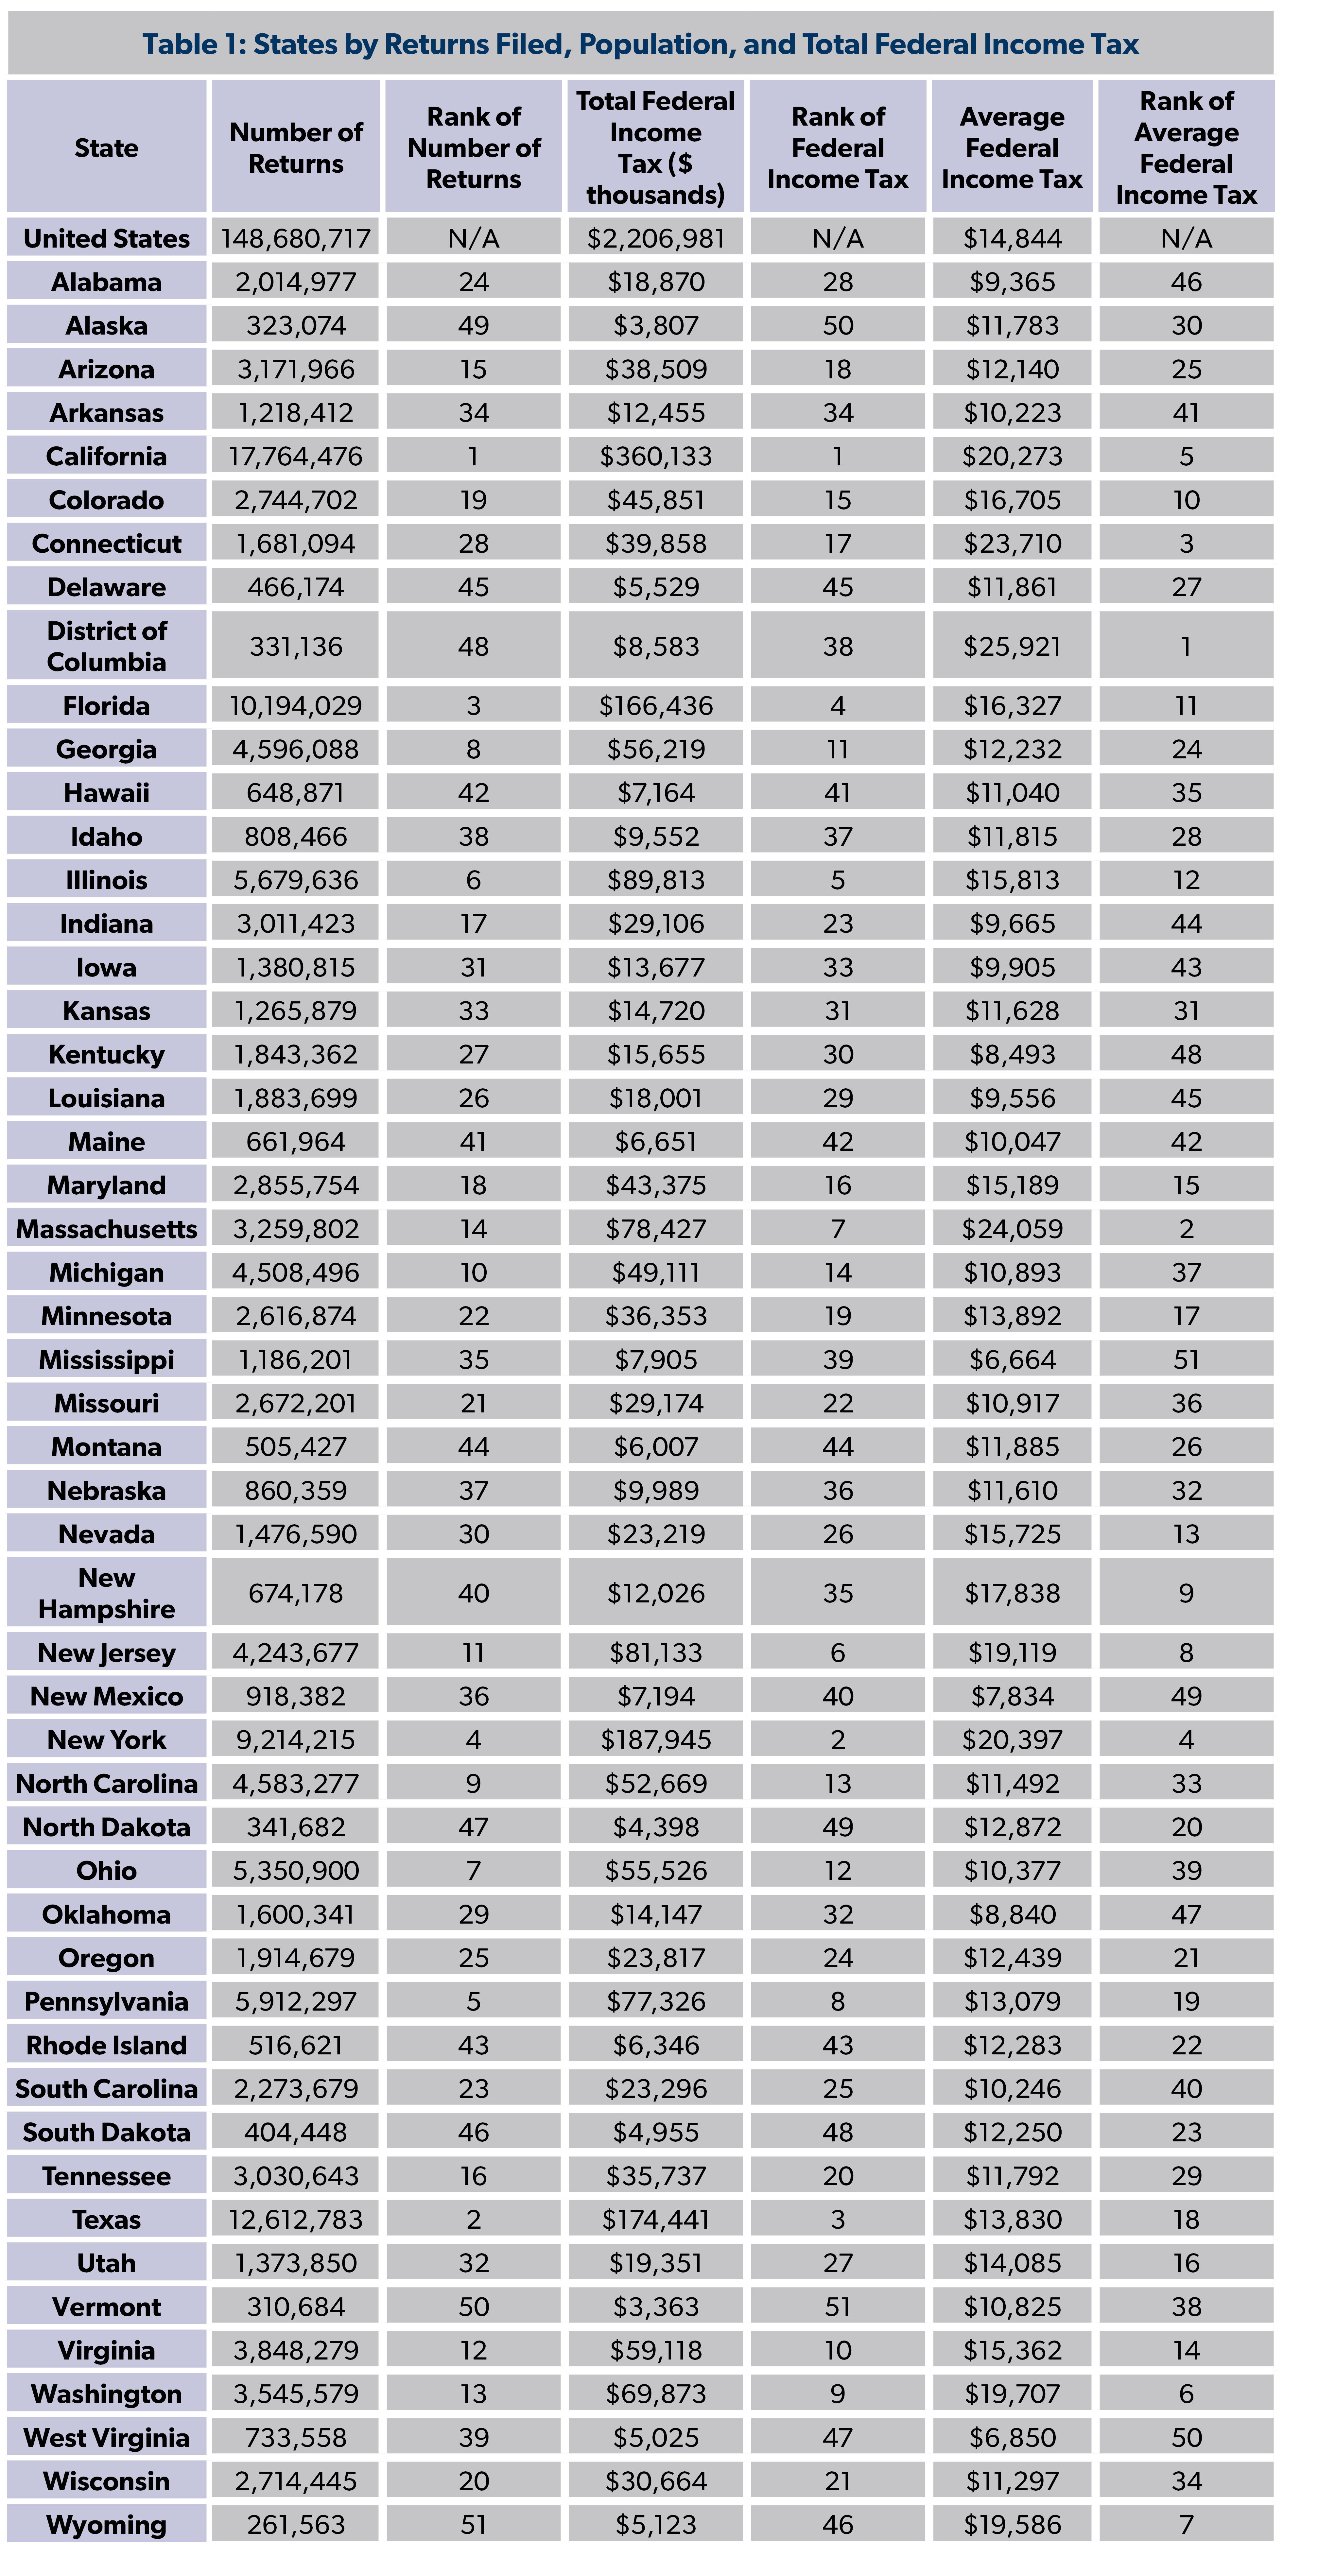
Unsurprisingly, the states with the largest populations generally paid the largest total federal income taxes. The top four states by total federal income tax paid in tax year 2021 also fall into the top four states by population per Census Bureau data that year and number of returns filed. These are California, New York, Texas, and Florida. Illinois also ranks in the top five states by federal tax paid, which is plausible as it had the sixth largest population in 2021 and sixth highest volume of tax returns filed. Illinois taxpayers paid more than Pennsylvania taxpayers because of higher total AGI in the state that year, indicating wealthier taxpayers.
For taxpayers in the top five states that had higher average federal income taxes paid per household, those households on average paid over $20,000 in federal income taxes in 2021. Taxpayers in the District of Columbia paid the highest average federal income taxes at $25,921 per household. Keep in mind that this is federal income tax, and these taxpayers are also likely subject to state and local taxes. Taxpayers in three of the five states with the highest average federal income tax paid per household are also subject to some of the highest state income tax rates: California, New York, and the District of Columbia.
Share of Income Taxes Paid by the Highest and Lowest Earners
Overall in the United States, the top 1 percent of earners pay 45 percent of the total federal income tax burden, despite earning only 25 percent of the total share of AGI. This is not just a nationwide generalization. The top 1 percent of earners in every state pays a significantly higher share of the federal income tax burden in that state compared to their share of AGI.
On average in the U.S., the top 1 percent pay 45 percent of the federal income tax burden despite earning 28 percent of AGI. The highest income taxpayers in Alaska pay a lower share of the federal income tax burden compared to their counterparts in other states, yet they still pay about 30 percent of the state’s total federal income tax share, while earning only half of the state’s total AGI. The top 1 percent of taxpayers in Tennessee pay the closest share of federal income taxes to the national average at 45.5 percent of Tennessee’s federal income tax share. The top 1 percent of taxpayers in Wyoming pay the highest share of the state’s federal income tax share at nearly 62 percent.
Meanwhile, the bottom 50 percent of earners in every state pay a significantly smaller share of the federal income tax burden relative to their share of AGI. In fact, these taxpayers pay less than 5 percent of the state’s total share of federal income taxes in every state except Iowa. In Florida, the taxpayers in the lowest earnings bracket pay as little as 1.7 percent of the state’s total federal income tax share, despite earning about 10 percent of the state’s AGI.
Table 2 shows the federal income tax share paid by the top 1 percent and bottom 50 percent of earners in each state, ranked by the share of the state’s federal income tax burden borne by the top 1 percent. Notably, the states with the highest (Wyoming) and lowest (Alaska) share both have very small populations compared to the rest of the United States. This can be explained by the fact that high-income taxpayers in Wyoming have a significantly larger total share of AGI in the state than high-income taxpayers in Alaska. That is not to say that there are more high-income taxpayers in Wyoming, but rather that they have greater AGI than high-income taxpayers in Alaska. The amount of returns filed by those in the top 1 percent of earners compared to the total returns filed in the state is very similar in both states.

Average Federal Tax Rates by State
In 2021, the ordinary income tax rate for the taxpayers in the lowest tax bracket was 10 percent of income. In our progressive tax system, tax rates gradually increase with income earned, until the point at which single taxpayers in the highest income bracket would have a federal tax liability of $157,804.25 plus 37 percent of income over $523,600. The overall average tax rate in the United States was 14.85 percent in 2021. It is important to note that the average tax rate takes into consideration the amount of taxpayers falling into each tax bracket as well as factors including credits and deductions that may reduce tax liability.
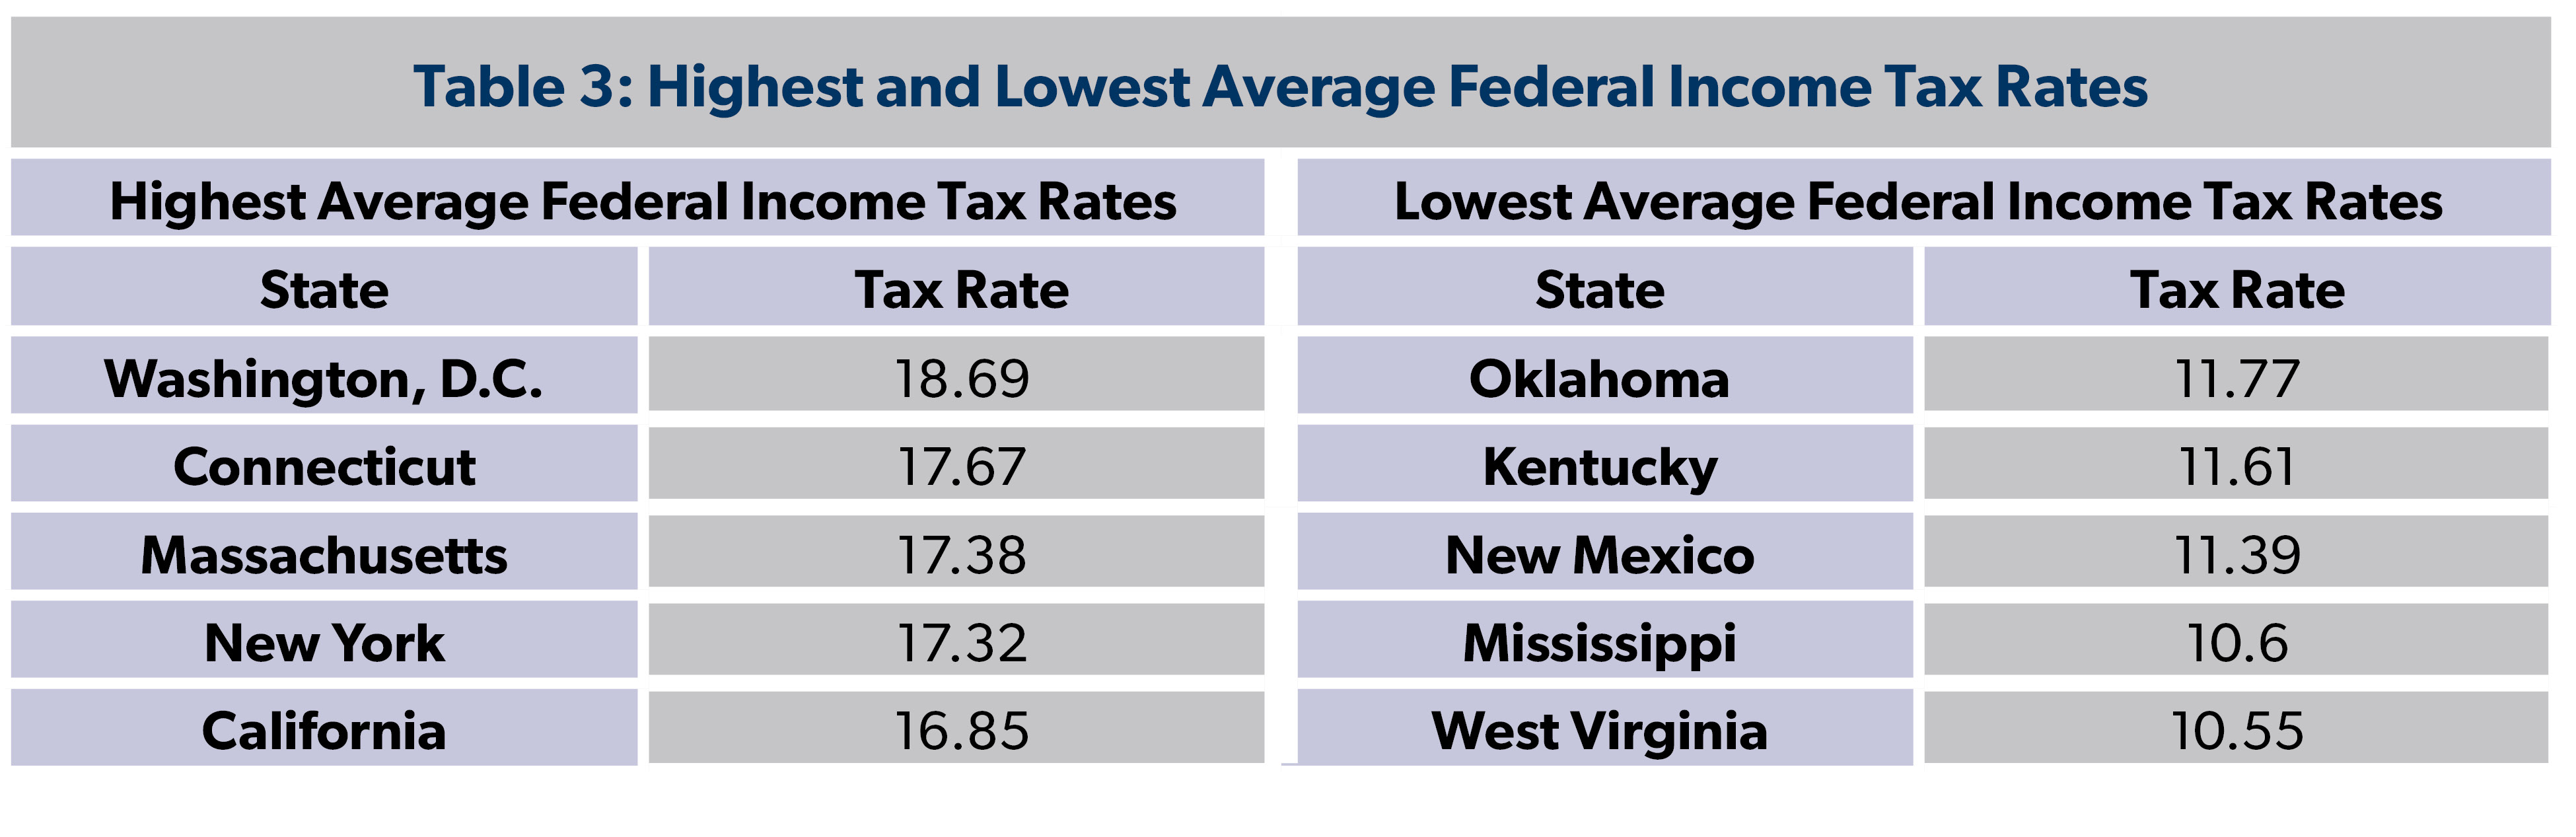
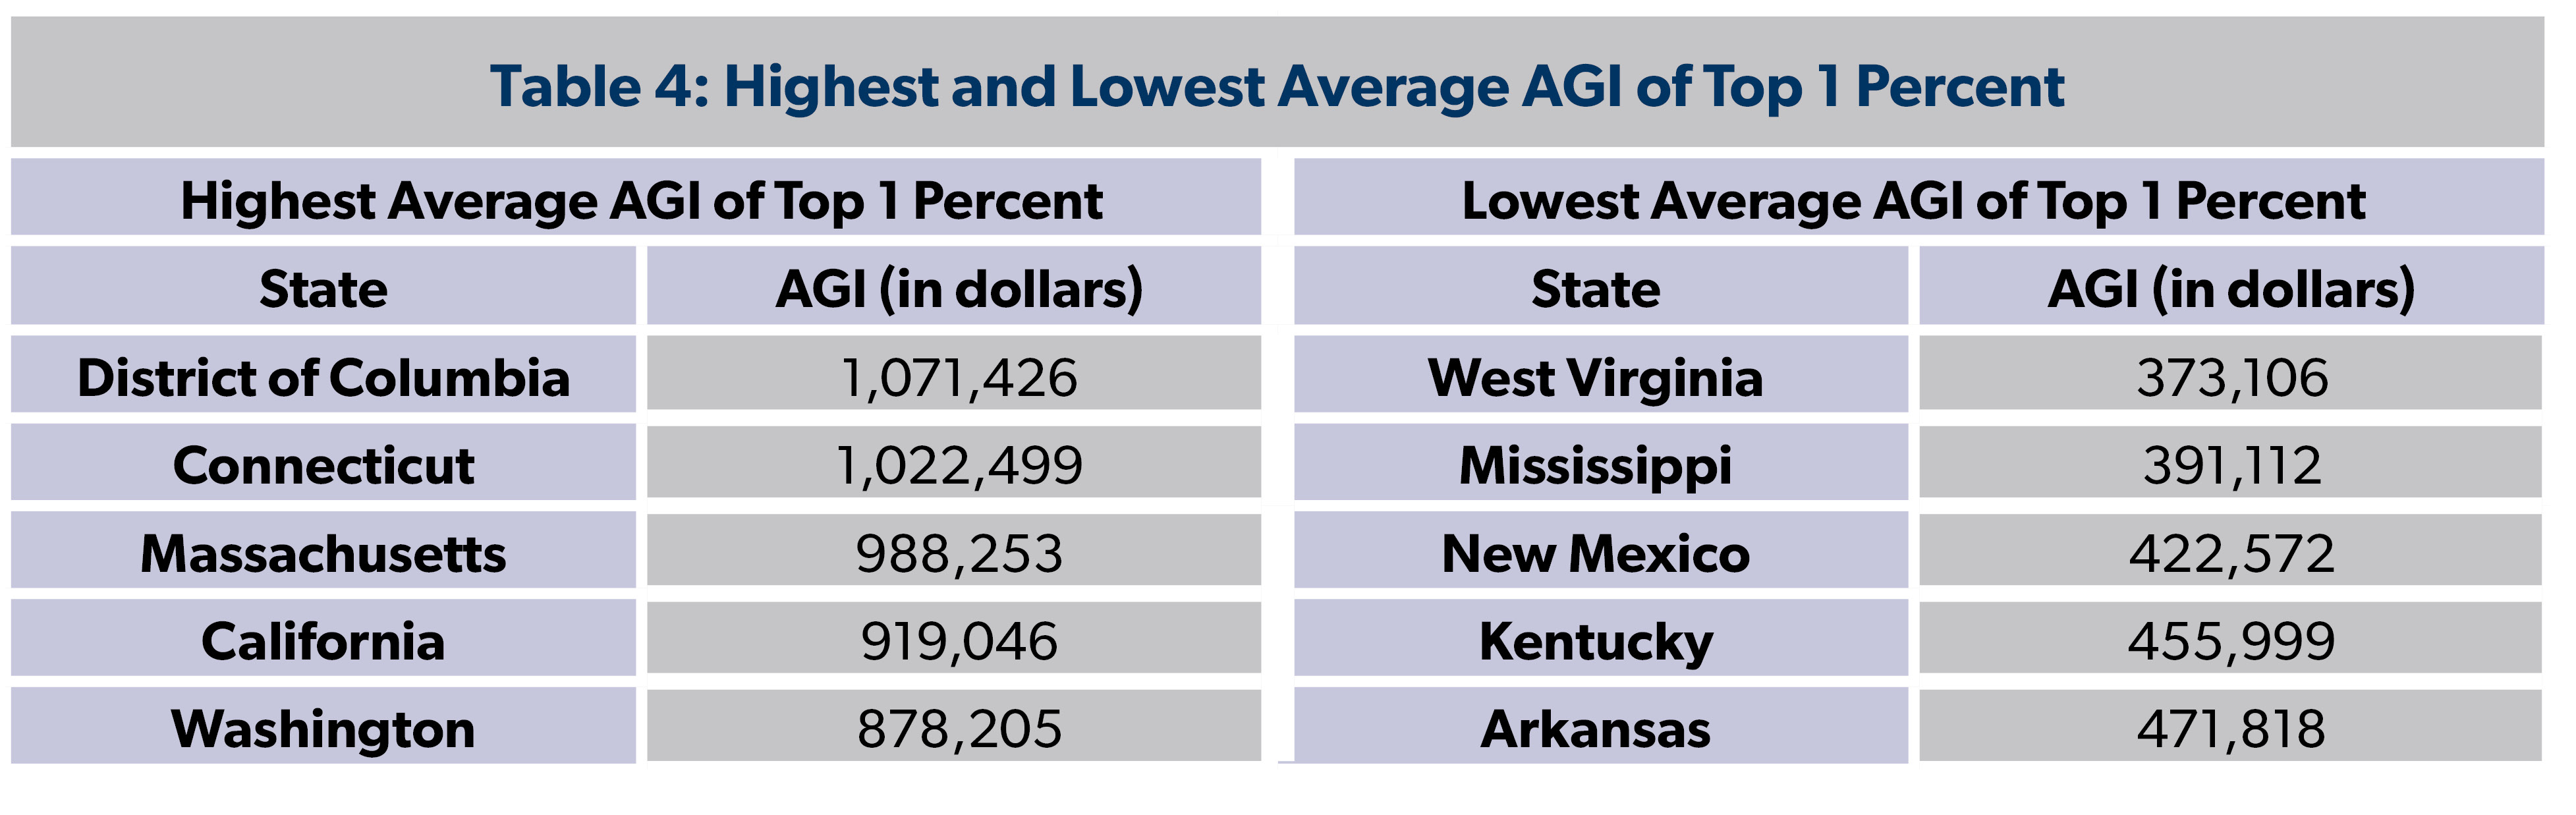
The Statistics of Income (SOI) data includes the average federal income tax rate for each state, which is largely dependent on the income levels of the state’s taxpayers. The minimum AGI of the top 1 percent in each state positively correlates with the average federal tax rate in each state. West Virginia had the lowest average federal income tax rate at 10.55 percent and also had the lowest income threshold to be considered part of the top 1 percent of earners at only $373,106. It is clear that the wealthier a state’s taxpayers are, the more the state pays in federal income taxes.
SOI also includes Washington, D.C., and its average tax rate tops that of all the states. Washington, D.C., had the highest average federal income tax rate at 18.69 percent and also had the highest income threshold to be considered part of the top 1 percent of earners at $1,071,426. As the nation’s capital, D.C. is home to many government workers and officials, which may contribute to its higher income levels and tax rates compared to other states.
Notably, of jurisdictions with the highest average tax liability, New York, California, and Connecticut also have very high state and local tax burdens. Given their relatively high combined state and federal tax burden, it is no surprise that NTUF finds that California, New York, Massachusetts, and Washington, D.C., are all experiencing significant outward tax migration. The states with the lowest average federal income tax rates and AGI have had a net gain of residents from other states in recent years.
Conclusion
When politicians issue calls to “tax the rich,” it is important to clarify who exactly is being targeted. It is evident that the wealthiest taxpayers are already paying more than their “fair share” of taxes, while those in the lowest income groups are able to pay less than their share. The top 10 percent of earners in every state pay more than 50 percent of the state’s total federal tax burden, with the bottom 50 percent of earners in every state paying 5.38 percent or less of the state’s federal tax burden.
National data is useful for an overall picture of who pays taxes, but state data allows us to better understand whether averages are reliable or caused by outliers and anomalies.The fact that the trend of the wealthy paying more holds true for 51 case studies across all the states plus Washington, D.C., should be a wake-up call for policymakers at both the state and federal level.