
The federal government passed a grim milestone on October 4: $31 trillion in gross federal debt.
An incredible 70 percent of that $31 trillion debt load was accumulated from the start of fiscal year (FY) 2008 (October 1, 2007) through FY 2022 (September 30, 2022), a period of just 15 years.
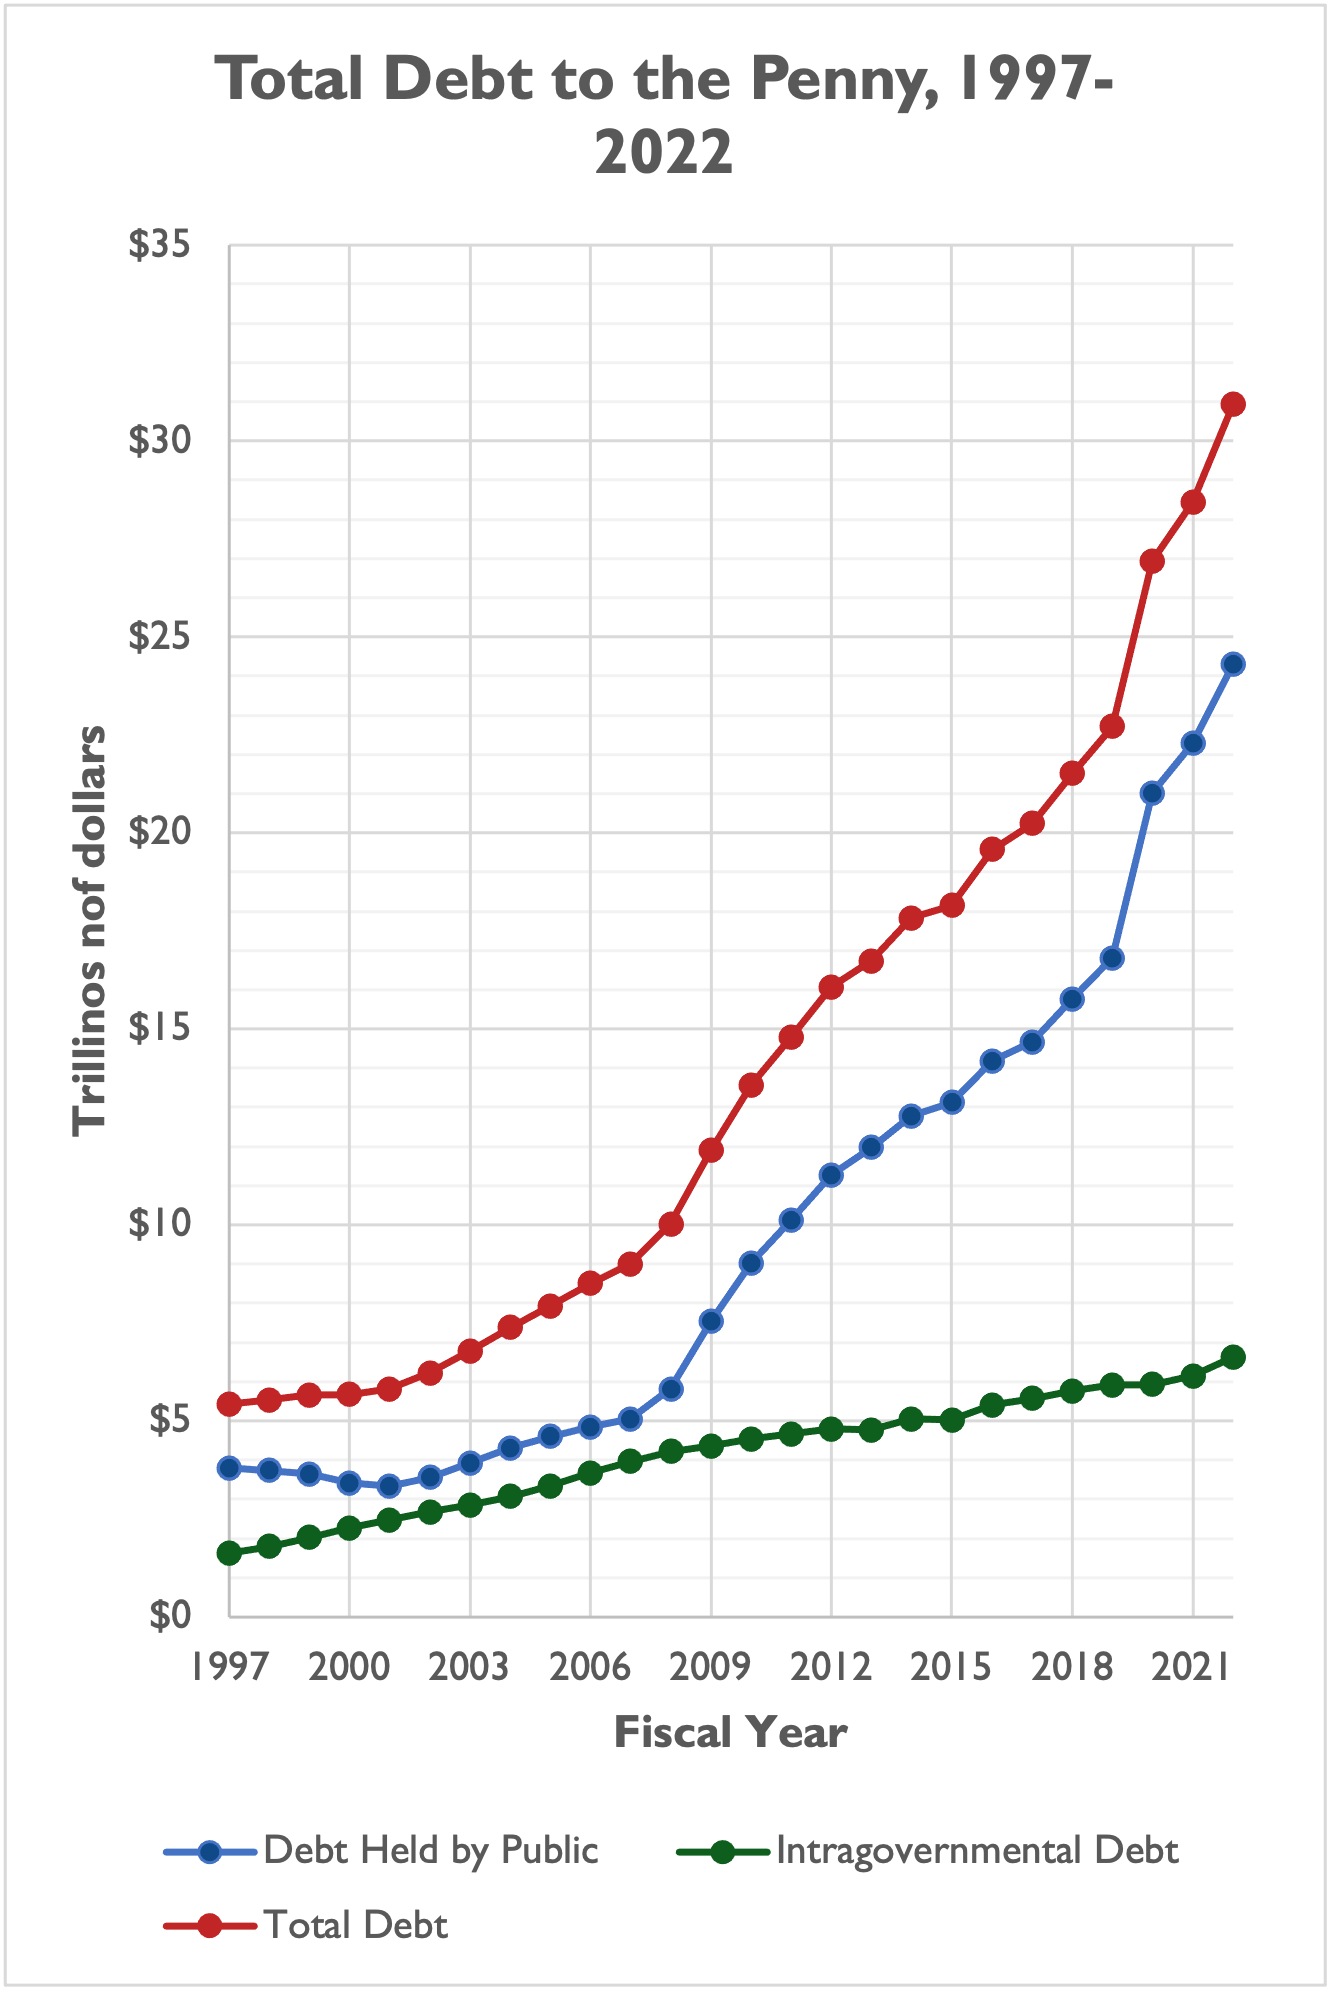
On October 1, 2007, George W. Bush was president of the United States, Democrats controlled Congress, and the global financial crisis and recession was getting underway. Total federal debt (comprising debt held by the public and intragovernmental holdings, the latter generally meaning debt the government owes itself) stood at $9 trillion.
Debt held by the public, which totaled $5 trillion of that $9 trillion, was just 35 percent of the size of the nation’s economy, as measured by gross domestic product (GDP). It is now hovering around 100 percent of GDP, and the nonpartisan Congressional Budget Office (CBO) estimates debt held by the public will stay around 100 percent of GDP, and eventually move higher than 100 percent, for decades to come.

Over the course of that 15 years (2008-2022) and several national crises – the Great Recession and the COVID-19 pandemic chief among them – Congresses and presidents controlled by both parties racked up debt on the taxpayers’ credit card, adding at least $325 billion to debt each and every year, at least $670 billion in 14 out of 15 years, at least $1 trillion in 12 out of 15 years, more than $2.5 trillion in two years, and an astounding $4.2 trillion in FY 2020 alone.
Even excluding intragovernmental holdings and just focusing on debt held by the public, the federal government added at least $335 billion in debt held by the public in all 15 years, at least $700 billion in 13 out of 15 years, at least $1 trillion in 10 out of 15 years, more than $2 trillion in two years, and $4.2 trillion in FY 2020 alone, as illustrated by the chart below.

The total tab is nearly $22 trillion in additional debt from FY 2008 through 2022, an average of $1.46 trillion per year. Before that, policymakers had added a net total of $4.8 trillion to debt held by the public from FY 1963 through FY 2007. (CBO measures debt held by the public back to FY 1963.) The skyrocketing debt load is illustrated below.

And here’s how net debt accumulation has broken down by decade:
- FY 1963 through FY 1969: +$30.1 billion
- FY 1970 through FY 1979: +$362.2 billion
- FY 1980 through FY 1989: +$1.550 trillion
- FY 1990 through FY 1999: +$1.442 trillion
- FY 2000 through FY 2009: +$3.912 trillion
- FY 2010 through FY 2019: +$9.256 trillion
- FY 2020 through FY 2022: +$7.498 trillion
Of course, Congress likely would have added to the nation’s debt load absent these crises. Federal policymakers have become all too used to spending more tax dollars than the government takes in, even in times of peace and prosperity.

As NTU Foundation’s Demian Brady has noted, federal spending per capita has also grown regularly in recent years, even as America’s population has grown. The federal government spent an average of $5,888 per person in the 1960s; in 2020 and 2021, the government spent an average of $23,290 per person.
A skeptical observer may ask: why does all of this matter? There has not yet been a U.S. debt crisis, as some feared would be the case years ago, despite the federal government’s rapid accumulation of debt held by the public in the past 15 years.
Policymakers should not rest easy, though. CBO has expertly explained the numerous consequences of unmanageable debt loads:
- Rising interest rates will require higher interest payments on existing debt by the U.S. government, and interest payments on existing debt will eat up a larger and larger share of revenues the government brings in;
- Increasing government debt crowds out private sector investment, “which would result in lower business investment and slow the growth of economic output over time”;
- Investors may lose confidence in the U.S. government’s ability to pay its bills, increasing the risk of a flight from U.S. debt which would raise borrowing costs for the federal government even further; and
- Rising debt makes it more difficult for U.S. policymakers to react to future economic and fiscal shocks, such as recessions, military conflicts, natural disasters, and public health crises.
Rising interest rates in particular could have a pernicious impact on deficits and debt absent any fiscal policy decisions made by Congress or the president.
Net interest spending is projected to be $8.5 trillion in the next 10 years according to CBO, an average of $847 billion per year. Net interest spending sits at around $400 billion per year currently, and accelerates to $1 trillion-plus by the early 2030s. A one-point increase in interest rates next year, under the alternative scenario outlined above, would raise net interest spending an additional $1.1 trillion over 10 years or $110 billion per year on average.


CBO has projected that U.S. debt will continue to skyrocket. Federal government spending as a percentage of GDP will rise above 25 percent in the 2030s and above 30 percent in the 2050s, driven by ever-increasing mandatory spending costs in Social Security and Medicare, while revenue hovers between 18 percent and 20 percent of GDP in each of the next 30 years:

This growing gap will cause debt held by the public to exceed 110 percent of GDP by 2033, 125 percent by 2038, 150 percent by 2045, and 180 percent by 2051:

These estimates from CBO may actually be conservative, given CBO does not account for future economic and fiscal shocks (such as recessions, natural disasters, wars, and pandemics) and CBO does not assume policymakers will add to the taxpayers’ credit card above and beyond how they are projected to do so under current law. (Future policymakers are almost certainly likely to increase spending beyond CBO’s baseline, and deficit-financed tax cuts or extensions of temporary tax cuts may reduce revenue beyond what CBO projects.)
Reducing debt back to 2007 levels (35 percent of GDP) or achieving balanced budgets are no longer realistic targets for Congress in the next decade or so. Even reducing debt levels modestly would be a herculean task for both parties in Congress – holding debt to roughly 95 percent of GDP 10 years from now (FY 2032) would require policymakers to achieve $5.4 trillion in debt reduction relative to current CBO projections.
But if lawmakers can’t even take small, modest steps toward more sustainable debt levels, they greatly increase the chance the U.S. experiences a federal debt crisis at some point in the coming decades. We have hit $31 trillion in gross debt faster than probably any policymaker could imagine in 2007. It’s time to tap the brakes, before $31 trillion seems as small in the future as $9 trillion seems now.